Us and the UN
 When you think of humanitarian crises like war, famine, earthquakes, storms and the like you probably don’t think “data”. But data is critical to humanitarian relief efforts, background questions like:
- What is the country we’re deploying to like in terms of population, geography, infrastructure, economic development, social structures?
- What resources, financial and human, are available to deploy?
Once a relief effort is underway more questions arise:
- How many people have been displaced this week and where are they now?
- How many tents have we deployed and how many more are needed?
- How do we safely get trucks from point A to point B?
ScraperWiki has been helping the United Nations Office for the Coordination of Humanitarian Affairs (UN-OCHA) with some of these questions.
The work is taking place in the Data and Analysis Project (DAP) in which we are playing a part by addressing the background data problem. There is lots of data on individual countries which has been collated to various locations such as the World Bank, the World Health Organisation, the CIA world factbook, wikipedia and so forth. Although these are all excellent resources, an analyst at the UN doesn’t want to be visiting all of these websites and wrangling their individual interfaces to get the data they need.
This is where ScraperWiki comes in – we’ve been scraping data from over 20 different websites to help build a Common Humanitarian Dataset. This will be supplemented by internal data from the UN and ultimately, the hardest data of all – operational data from the field, which comes in many and various forms.
From a technical point of view the websites we have scraped do not present great challenges, they are international organisations with mandates to make data available, often supplying an API to make data more readily accessible by machine. Although it’s worth noting that sometimes scraping a webpage is easier than using an API because a webpage is self-documenting for humans and an API may not be well documented, or even reveal all of the underlying data.
Our technical challenge has been in ensuring the consistency and comparability of data. The UN is particularly sensitive about the correct and diplomatic naming of geographic entities. Now the initial data is in, the UN can start to use it, obviously we don’t pass on a chance to have a look at some new data either! The UN are building systems to make the data available in a variety of ways but in the first instance both in ScraperWiki and the UN we’ve been using Tableau both for visualising the data and for transforming the data into formats more suitable for analysis in spreadsheet formats which are still the lingua franca for numerical data.
In total we’ve collected over 300,000 data points for 240 different regions (mostly countries – plus dependent territories such as Martinique, Aruba, Hong Kong, French Guiana and so forth), covering a period of 60 years with 233 different indicators. You can get an overview of all this data from the chart below which shows the number of values we have for each year, coloured by the data source:
The amount of data available for each country varies, recent created countries such as South Sudan don’t have a lot of data associated with them similarly Caribbean and Pacific Islands, often dependent territories are also lacking.
We’ve been able to quickly slice out data for the 24 countries in which the UN have offices and they’ve been able to join this with some of their internal data to get live position reports.
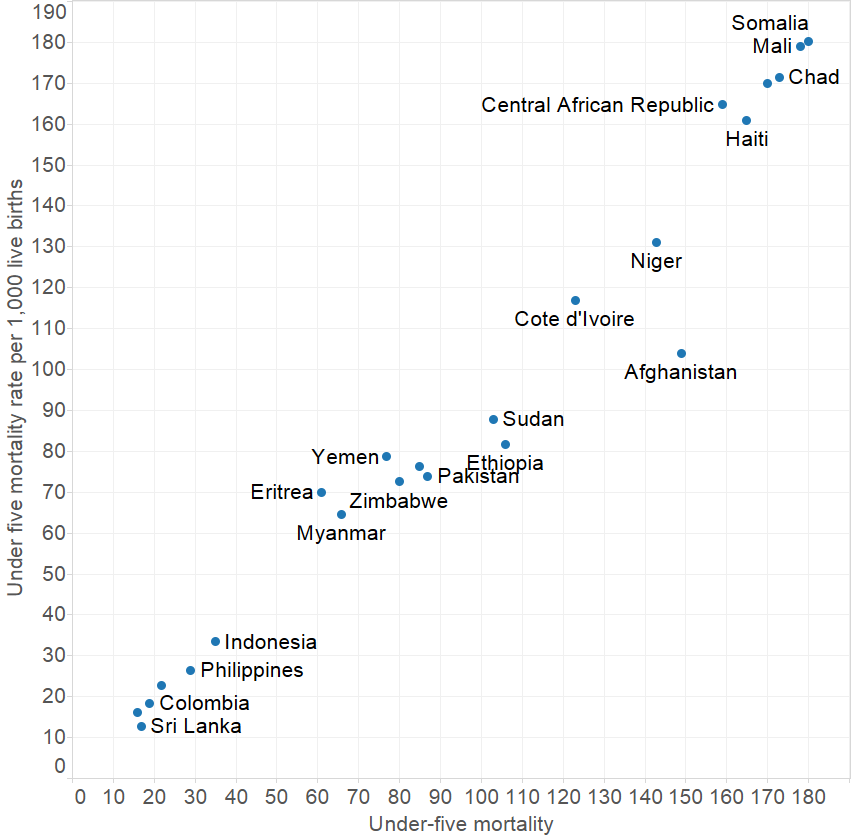
To give a few examples, here is under five mortality data for 2010 from two different sources, we can see here that the two sources are highly correlated but not necessarily identical.
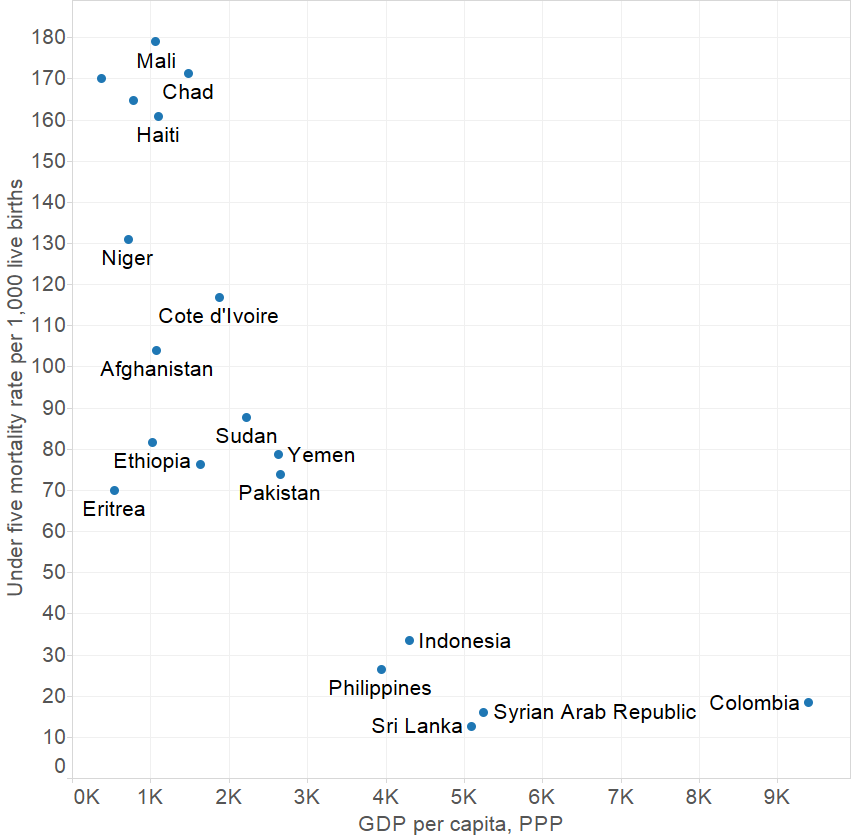
We can see that increasing GDP is correlated with a reduction in under five mortality but only up to a point:
This is only a start, there are endless things to find in this data!
UN-OCHA will soon launch an alpha instance for this data through their ReliefWeb Labs site (labs.reliefweb.int).


