Stories are now found in data
There is so much information in the world today, it is hard to keep up with Governments, businesses or even criminals, without using data to help find stories.
ScraperWiki has helped journalists become data journalists ever since we were founded in 2009, organizing Hacks & Hackers days to get together reporters and geeks all over the UK and US.
We recommend the Data Journalism Handbook, which is free on the web, to get going. It has sections about ScraperWiki.
ScraperWiki helps journalists:
- Write and host your own web scrapers
- Convert Government data from PDFs into spreadsheets
- Learn about data science, coding and visualization
Contact us
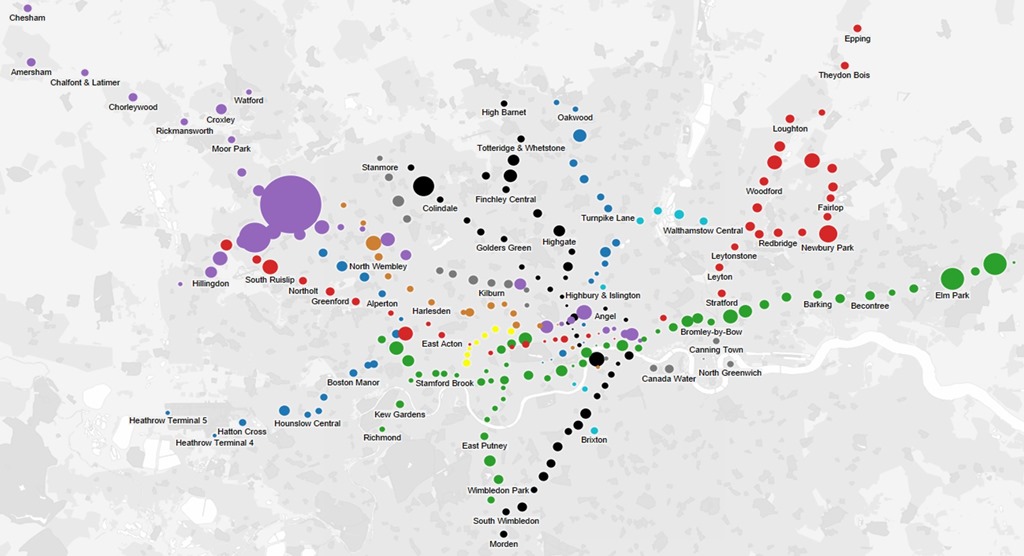
Case Study: London Underground
These data were then fed into Tableau, the business intelligence and analytics software, and built a visualisation which showed the data overlaid on the classic underground map. Tableau’s interactive web functionality allows us to share this visualisation for everyone to enjoy.
Shortly after making this visualisation a strike by London Underground workers was announced, so we quickly whipped up the “Should I walk it?” tool which allows users to estimate how long it would take them to walk between stations.
Tableau works well with ScraperWiki’s Platform, we added an OData connector so data can be pulled into the platform and then fed out live via the OData connector to Tableau.
This visualisation now appears in the Regional sample workbook distributed as part of Tableau 9.
![]()
Data Science Platform: Journalist accounts
We offer special access to our Data Science Platform for journalists, which allows you to create 20 datasets for free.
If you’re a Journalist please email hello@scraperwiki.com with the subject “Journalist”. Tell us the user name you want to use (or existing one if you already have one).
We’re not asking people to confirm that they are affiliated to any official press organisations – this may change in future. We do however require that you actively do public interest journalism.
Remember: Please cite us in your story