Book Review: R in Action by Robert I. Kabacoff
 This is a review of Robert I. Kabacoff’s book R in Action which is a guided tour around the statistical computing package, R.
My reasons for reading this book were two-fold: firstly, I’m interested in using R for statistical analysis and visualisation. Previously I’ve used Matlab for this type of work, but R is growing in importance in the data science and statistics communities; and it is a better fit for the ScraperWiki platform. Secondly, I feel the need to learn more statistics. As a physicist my exposure to statistics is relatively slight – I’ve wondered why this is the case and I’m eager to learn more.
In both cases I see this book as an atlas for the area rather than an A-Z streetmap. I’m looking to find out what is possible and where to learn more rather than necessarily finding the detail in this book.
R in Action follows a logical sequence of steps for importing, managing, analysing, and visualising data for some example cases. It introduces the fundamental mindset of R, in terms of syntax and concepts. Central of these is the data frame – a concept carried over from other statistical analysis packages. A data frame is a collection of variables which may have different types (continuous, categorical, character). The variables form the columns in a structure which looks like a matrix – the rows are known as observations. A simple data frame would contain the height, weight, name and gender of a set of people. R has extensive facilities for manipulating and reorganising data frames (I particularly like the sound of melt in the reshape library).
R also has some syntactic quirks. For example, the dot (.) character, often used as a structure accessor in other languages, is just another character as far as R is concerned. The $ character fulfills a structure accessor-like role. Kabacoff sticks with the R user’s affection for using <- as the assignment operator instead of = which is what everyone else uses, and appears to work perfectly well in R.
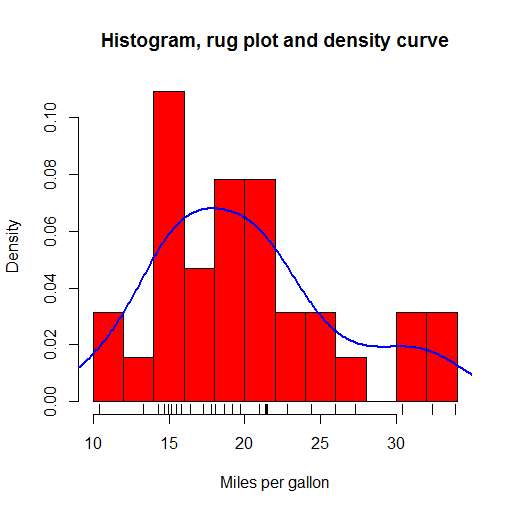
R offers a huge range of plot types out-of-the-box, with many more a package-install away (and installing packages is a trivial affair). Plots in the base package are workman-like but not the most beautiful. I liked the kernel density plots which give smoothed approximations to histogram plots and the rug plots which put little ticks on the axes to show where the data in the body of that plot fall. These are all shown in the plot below, plotted from example data included in R.
The ggplot2 package provides rather more beautiful plots and seems to be the choice for more serious users of R.
The statistical parts of the book cover regression, power analysis, methods for handling missing data, group comparison methods (t-tests and ANOVA), and principle component and factor analysis, permutation and bootstrap methods. I found it a really useful survey – enough to get the gist and understand the principles with pointers to more in-depth information.
One theme running through the book, is that there are multiple ways of doing almost anything in R, as a result of its rich package ecosystem. This comes to something of a head with graphics in the final section: there are 4 different graphics systems with overlapping functionality but different syntax. This collides a little with the Matlab way of doing things where there is the one true path provided by Matlab alongside a fairly good, but less integrated, ecosystem of user-provided functionality.
R is really nice for this example-based approach because the base distribution includes many sample data sets with which to play. In addition, add-on packages often include sample data sets on which to experiment with the tools they provide. The code used in the book is all relatively short; the emphasis is on the data and analysis of the data rather than trying to build larger software objects. You can do an awful lot in a few lines of R.
As an answer to my statistical questions: it turns out that physics tends to focus on Gaussian-distributed, continuous variables, while statistics does not share this focus. Statistics is more generally interested in both categorical and continuous variables, and distributions cannot be assumed. For a physicist, experiments are designed where most variables are fixed, and the response of the system is measured as just one or two variables. Furthermore, there is typically a physical theory with which the data are fitted, rather than a need to derive an empirical model. These features mean that a physicist’s exposure to statistical methods is quite narrow.
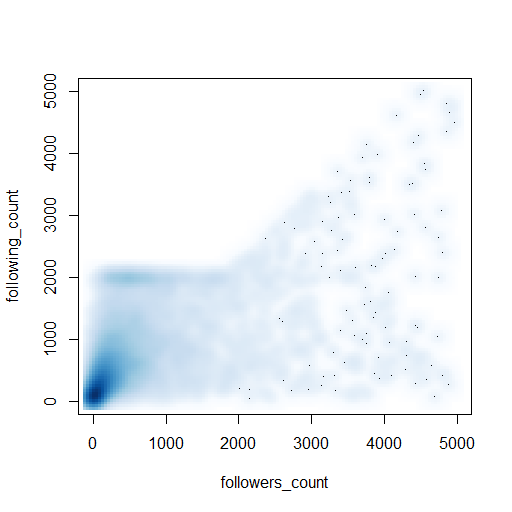
Ultimately I don’t learn how to code by reading a book, I learn by solving a problem using the new tool – this is work in progress for me and R, so watch this space! As a taster, just half a dozen lines of code produced the appealing visualisation of twitter profiles shown below:
(Here’s the code: https://gist.github.com/IanHopkinson/5318354)


Prize to first person to comment explaining why there’s nobody at the top left of that Twitter diagram, and what the straight line boundary coming out from 2000 following is!
Quoting from their docs: “Every account can follow 2,000 users total. Once you’ve followed 2,000 users, there are limits to the number of additional users you can follow. This number is different for each account and is based on your ratio of followers to following; this ratio is not published.” I guess we can safely conclude the secret ratio is not far from 1.
Yes, that’s right. Francis didn’t say what your prize would be before he went off on holiday!
Where’s your dozen lines of code?
It’s in this view here:
http://x.scraperwiki.com/dataset/bdaw7xa/view/hipbzxi
plus loads of other stuff
Any chance of putting it into a Gist, or something public, online?
Here you go – my first gist!
https://gist.github.com/IanHopkinson/5318354