A sea of data
 My friend Simon Holgate of Sea Level Research has recently “cursed” me by introducing me to tides and sea-level data. Now I’m hooked. Why are tides interesting? When you’re trying to navigate a super-tanker into San Francisco Bay and you only have few centimetres of clearance, whether the tide is in or out could be quite important!
The French port of Brest has the longest historical tidal record. The Joint Archive for Sea Level has hourly readings from 1846. Those of you wanting to follow along at home should get the code:
[sourcecode language=”text”]
git clone git://github.com/drj11/sea-level-tool.git
cd sea-level-tool
virtualenv .
. bin/activate
pip install -r requirements.txt
[/sourcecode]
After that lot (phew!), you can get the data for Brest by going:
[sourcecode language=”text”]
code/etl 822a
[/sourcecode]
The sea level tool is written in Python and uses our scraperwiki library to store the sea level data in a sqlite database.
Tide data can be surprisingly complex (the 486 pages of [PUGH1987] are testimony to that), but in essence we have a time series of heights, z. Often even really simple analyses can tell us interesting facts about the data.
As Ian tells us, R is good for visualisations. And it turns out it has an installable RSQLite package that can load R dataframes from a sqlite file. And I feel like a grown-up data scientist when I use R. The relevant snippet of R is:
[sourcecode language=”r”]
library(RSQLite)
db <- dbConnect(dbDriver(‘SQLite’), dbname=’scraperwiki.sqlite’, loadable.extensions=TRUE)
bre <- dbGetQuery(db, ‘SELECT*FROM obs WHERE jaslid==”h822a” ORDER BY t’)
[/sourcecode]
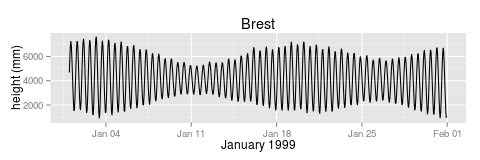
I’m sure you’re all aware that the sea level goes up and down to make tides and some tides are bigger than others. Here’s a typical month at Brest (1999-01):
There are well over 1500 months of data for Brest. Can we summarise the data? A histogram works well:
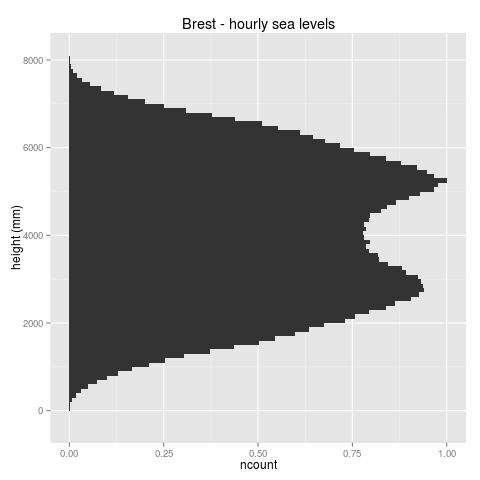
Remember that this is a histogram of hourly sea level observations. So the two humps show the most frequent sea level heights that appear in the hourly series. These are clustered around two heights that are more commonly observed than all others. These are the mean low tide, and the mean high tide. The range, the distance between mean low tide and mean high tide, is about 2.5 metres (big tides, big data!).
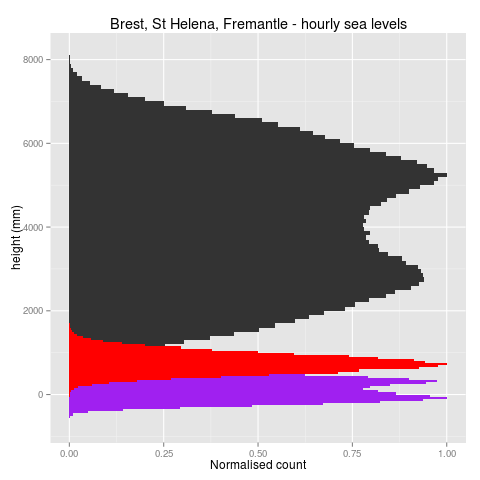
This is a comparitively large range, certainly compared to a site like St Helena (where the British imprisoned Napoleon after his defeat at Waterloo). Let’s plot St Helena’s tides on the same histogram as Brest, for comparison:
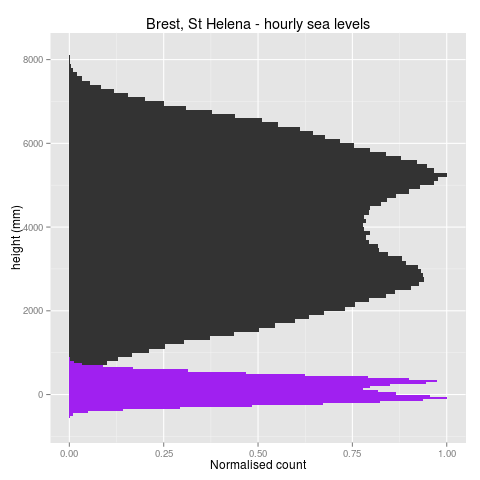
Again we have a mean low tide and a mean high tide, but this time the range is about 0.4 metres, and the entire span of observed heights including extremes fits into 1.5 metres. St Helena is a rock in the middle of a large ocean, and this small range is typical of the oceanic tides. It’s the shallow waters of a continental shelf, and complex basin dynamics in northwest Europe (and Kelvin waves, see Lucy’s IgniteLiverpool talk for more details) that gives ports like Brest a high tidal range.
Notice that St Helena has some negative sea levels. Sea level is measured to a 0-point that is fixed for each station but varies from station to station. It is common to pick that point as being the lowest sea level (either observed or predicted) over some period, so that almost all actual observations are positive. Brest follows the usual convention, almost all the observations are positive (you can’t tell from the histogram but there are a few negative ones). It is not clear what the 0-point on the St Helena chart is (it’s clearly not a low low water, and doesn’t look like a mean water level either), and I have exhausted the budget for researching the matter.
Tides are a new subject for me, and when I was reading Pugh’s book, one of the first surprises was the existence of places that do not get two tides a day. An example is Fremantle, Australia, which instead of getting two tides a day (semi-diurnal) gets just one tide a day (diurnal):
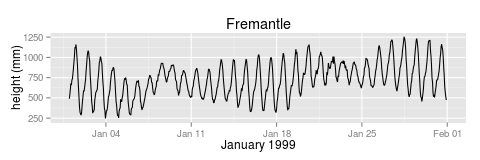
The diurnal tides are produced predominantly by the effect of lunar declination. When the moon crosses the equator (twice a nodical month), its declination is zero, the effect is reduced to zero, and so are the diurnal tides. This is in contrast to the twice-daily tides which, while they exhibit large (spring) and small (neap) tides, we still get tides whatever time of the month it is. Because of the modulation of the diurnal tide there is no “mean low tide” and “mean high tide”, tides of all heights are produced, and we get a single hump in the distribution (adding the fremantle data in red):
So we’ve found something interesting about the Fremantle tides from the kind of histogram which we probably learnt to do in primary school.
Napoleon died on St Helena, but my investigations into St Helena’s tides will continue on the ScraperWiki data hub, using a mixture of standard platform tools, like the summarise tool, and custom tools, like a tidal analysis tool.
Image “Napoleon at Saint-Helene, by Francois-Joseph Sandmann,” in Public Domain from Wikipedia