Summarise #1: Grouping automatically for you
Late at night, after a long conversation in a bar (after Social Media Cafe), Zach mentioned one feature that everyone loved about Kasabi. It had an overview page, which automatically summarised each dataset.
Of course, Kasabi did it using linked data – telling you how many of your triples were geographic locations, and how many were names of places, using their schema. Someone at Ordnance Survey used that to at glance see they didn’t have as many places geocoded as they thought.
This made me realise that one of the first things I do when I get a new dataset into ScraperWiki, is run some basic “group by” queries on it. That’s a way of counting how often different values appear for a particular column in your data – the kind of thing you do with pivot tables in Excel.
In some sense, it’s the relational database equivalent to counting the types of triples.
Couldn’t it be done automatically? Do a group by on every column, and show the ones that are interesting? I stayed up late into the night, and made a first prototype tool.
Here’s what it looked like, on the Climate Code Foundation‘s dataset of sea-level stations.
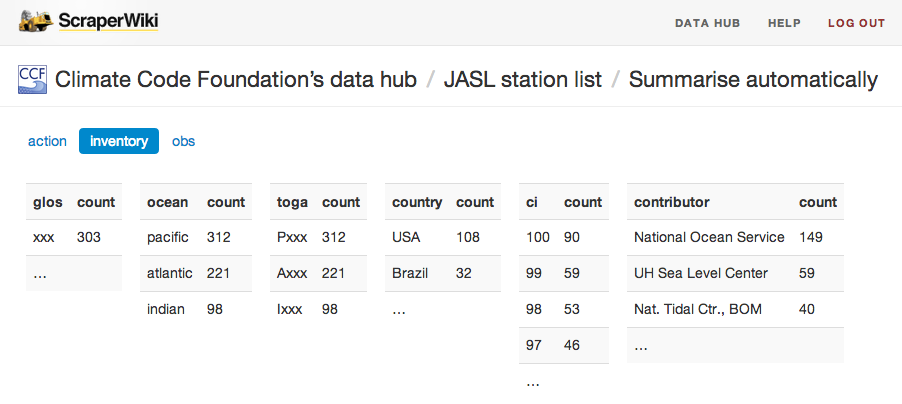 David Jones, who put the dataset in ScraperWiki, could immediately see what he hadn’t known before – that the “toga” tags (e.g. Pxxx) are never more specific than just which ocean they apply to (e.g. Pacific).
We tried it out on a few more datasets, with surprisingly useful results in most cases. I realised it could do a bit more than that – detect more cases of unusual data, understand types of data, and automatically show relevant graphs and charts.
Why fiddle around with SQL or pivot tables by hand, when you can get much of what you need automatically?
The Summarise Automatically tool (or some derivation) will be part of the new ScraperWiki platform, and if you would like to help us get this right, email new@scraperwiki.com to join the beta queue!
Leigh Dodds gives some background on the Kasabi feature here: http://blog.ldodds.com/2013/03/04/what-does-a-dataset-contain/