Summarise #4: Images and domains
(This is the fourth part in a series of posts about the “Summarise this dataset” tool on the new beta.scraperwiki.com platform – go there and sign up for free to try it out! The code is open source; take a look in facts.js for the key parts)
URLs are a type of data that is particularly easy to detect. The summarise tool does a reasonable job of displaying them anyway, but a couple of tricks make it even better.
The first insight is that just as time can be grouped by days or months or years, URLs can – in theory – be grouped by protocol, domain, partial paths or query parameters. We found the domain was the most useful, as it shows which website the URLs are from.
For example, I use a tool called Pocket to bookmark things to read or watch later on my phone. This is the list of the most common websites I bookmark that way:

Images are another common kind of URL that is easy to detect. A regular expression catches most of them automatically based on the file extension. (Although see this bug, at some point we’ll need a semantic layer…)
Here you can see the top artwork tracks from a Last.fm scraper, which gets the data of all the music that I’ve ever listened to:
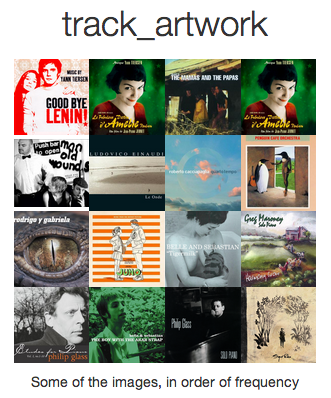
You can immediately see that Yann Tiersen features heavily in the most replayed, with both Goodbye Lenin! and Amelie.
As explained in Summarise #2: Pies and facts, the summarise tool generates lots of different “facts” about the data. It then has a ranking algorithm to decide which are the best to show.
When the data is a URL, extra facts as described above (tables of website domains, collages of images) are generated. The tool then selects whether those are more interesting than the basic facts about the URLs.
For example, if there were only a few different URLs, they might all be shown in a pie. But if there were a lot more, but from only a few domains, then the domains would be shown in a pie.
Try it yourself! Use “Create a dataset” to get some data into new ScraperWiki. Then pick “Summarise this data” from the tools menu and see what it tells you.
Next time – words and countries! And then, a final post to round it up, about data that is (nearly) always one type, and other interesting tidbits.
Trackbacks/Pingbacks
[…] they’re produced, what they contain, etc. I’ve been reading with interest the series on dataset summaries in Scraperwiki which is exploring similar […]