Yahoo!Finance to Tableau via ScraperWiki
Our recently announced OData connector gives Tableau users access to a world of unstructured and semi-structured data.
In this post I’d like to demonstrate the power of a Python library, Pandas, and the Code in a Browser tool to get “live” stock market data from Yahoo!Finance into Tableau. Python is a well-established programming language with a rich ecosystem of software libraries which can provide access to a wide range of data.
This isn’t a route to doing high frequency trading but it is a demonstrates the principles of using ScraperWiki as an adaptor to data on the web. Although Tableau supports a wide range of data connections it can’t handle everything. As well as ready-made tools to collect data and serve it up in different formats, ScraperWiki allows users to write their own tools. The simplest method is to use the “Code in a browser” tool.
I wrote about the Pandas library a few weeks ago, its designed to provide some of the statistical and data processing functionality R to users of Python. It grew out of the work of a financial analyst, Wes McKinney, so naturally he added a little piece of functionality to pull in stock market data from Yahoo!Finance. The code required to do this is literally a single line.
To make data we collect using the pandas library available to all of ScraperWiki tools, like the OData connector or the View in a Table tool, we need to write the data into a local database.
You can see the code to get Yahoo!Finance data and make it available in the screenshot below, and you can get a copy directly from this GitHub gist.
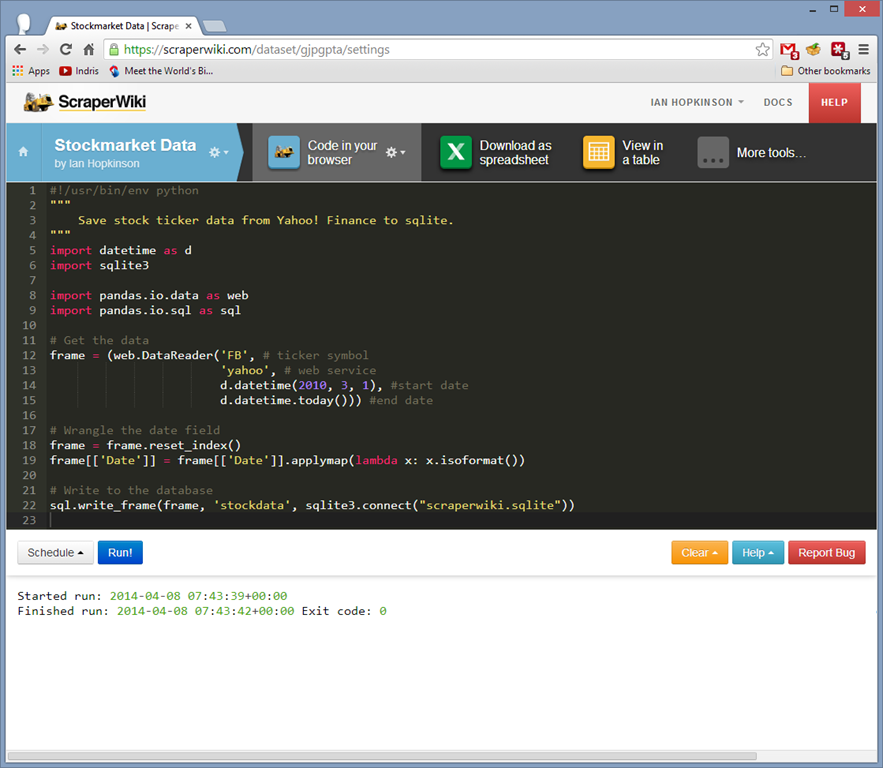
Once you’ve entered the code, then you can run it immediately or schedule it to run regularly.
In less than 10 lines of code we’ve added a new data source to Tableau!
The most complicated part of the process is getting the pandas library to recognise the dates properly. This is by no means a polished tool but it is fully functioning and can easily be modified to collect different stock data. Obvious extensions would be to collect a list of stocks, and to provide a user interface.
Once we have the data then we can access it over OData, I followed Andrew Watson’s instructions for making a “candlestick” plot (here). And the resulting plot is shown below and can be found on Tableau Public.

On a desktop installation of Tableau you can refresh the data at the click of a button.
What data can you get in less than 10 lines of code?