Which GOV.UK department is most mobile?
We recently made 37 dashboards for GOV.UK, full of stats about what people look at on the Government’s website.
As you know, the best data opens itself, so I asked myself, what does the underlying data behind these new dashboards secretly reveal?
Each dashboard shows the devices people used to access a department.
If you mush that together across all the departments, I asked myself, which one do people most read from mobile phones?
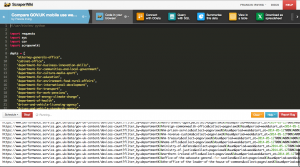
First I used ScraperWiki to code in my browser, scraping the raw JSON data behind the dashboards out from the Government’s Performance Platform.
It’s a pretty simple scraper.
I used my browser’s network inspector to find the URLs of the JSON. I hard coded the list of departments, and the date (week beginning 12th May 2014) for convenience. The Python code is here, and a CSV file of the data.
I’ve been meaning to try out Tableau for a while, especially as it works so seamlessly with ScraperWiki. There’s a newly released Mac version and it has a free trial. It was pretty easy to use, even for a programmer scared of GUIs like me.
I connected to ScraperWiki via OData (direct OData link if you want to follow along).
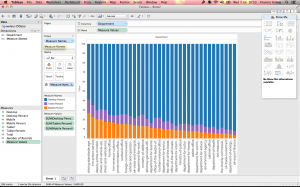
And then used these instructions to build a simple stacked bar graph.
You can play with an interactive version of the chart over on Tableau Public (where it’s free to publish public data).
And the answer?
The top department for mobile use is the Driving Standards Agency. I’m not sure if this is because young people applying for licenses are more likely to be using their phones, or whether it is that people are accessing the site while out driving…
The second is HM Prison Service. It seems logical that mobile Internet is important to prisoners and their relatives, and perhaps even to prison officers.
Next, try out ScraperWiki for yourself!


