Exploring the ONS
The Office for National Statistics (ONS) is the United Kingdom statistical body charged by the government with the task of collecting and publishing statistics related to the economy, population and society of England and Wales at national, regional and local levels. The data is typically published in the form of Excel spreadsheets.
The ONS is working on opening up their data, and making it more accessible to users. We’ve been doing a bit of work to help with that. This is typical of a number of jobs we have done. A customer has a website containing content which they want to move/process/republish elsewhere. The current website might have been built by aggregation over a number of years, and the underlying structure of the Content Management System may not be available to them. In these circumstances making a survey of the pre-existing content is an obvious first step.
The index for the ONS reference tables and datasets can be found here. Each dataset has a title, a release date, and the type of dataset. There is also a URL to the dataset inside the title field there is an indication of the size of the file. We wrote a simple scraper to collect these pieces of information.
First up, we’ll looking at the topics of the data released. There are a couple of routes into discovering these, one is to read the titles, this is OK as an approach but the titles are quite wordy and sometimes it isn’t clear what they refer to. An alternative, in this case, is to look at the URLs to the documents.They look something like this:
http://www.ons.gov.uk/ons/rel/lms/labour-market-statistics/november-2013/table-unem03.xls
This can be quite revealing since even if the website is not explicit about its structure the URLs can reveal the structure the builder used. We process the URLs by splitting them at the backslashes. The first part http://www.ons.gov.uk/ons/rel is common to all the URLs. Subsequent parts we can use to define a hierarchy. In this case we will focus on the fourth part of the hierarchy – “labour-market-statistics” in this instance, this gives us a human readable description of a topic. There are approximately 400 topics as defined by this metric as opposed to 90 or so defined by the third level of the hierarchy. Using the fourth level of the hierarchy key areas of the website by numbers of documents are:
- Labour market statistics
- National population projections
- Family spending
- Subnational labour market statistics
- Census
- Annual survey of hours and earnings.
We can visualise this as a treemap, here I am simply showing the top 20 areas by number of documents:
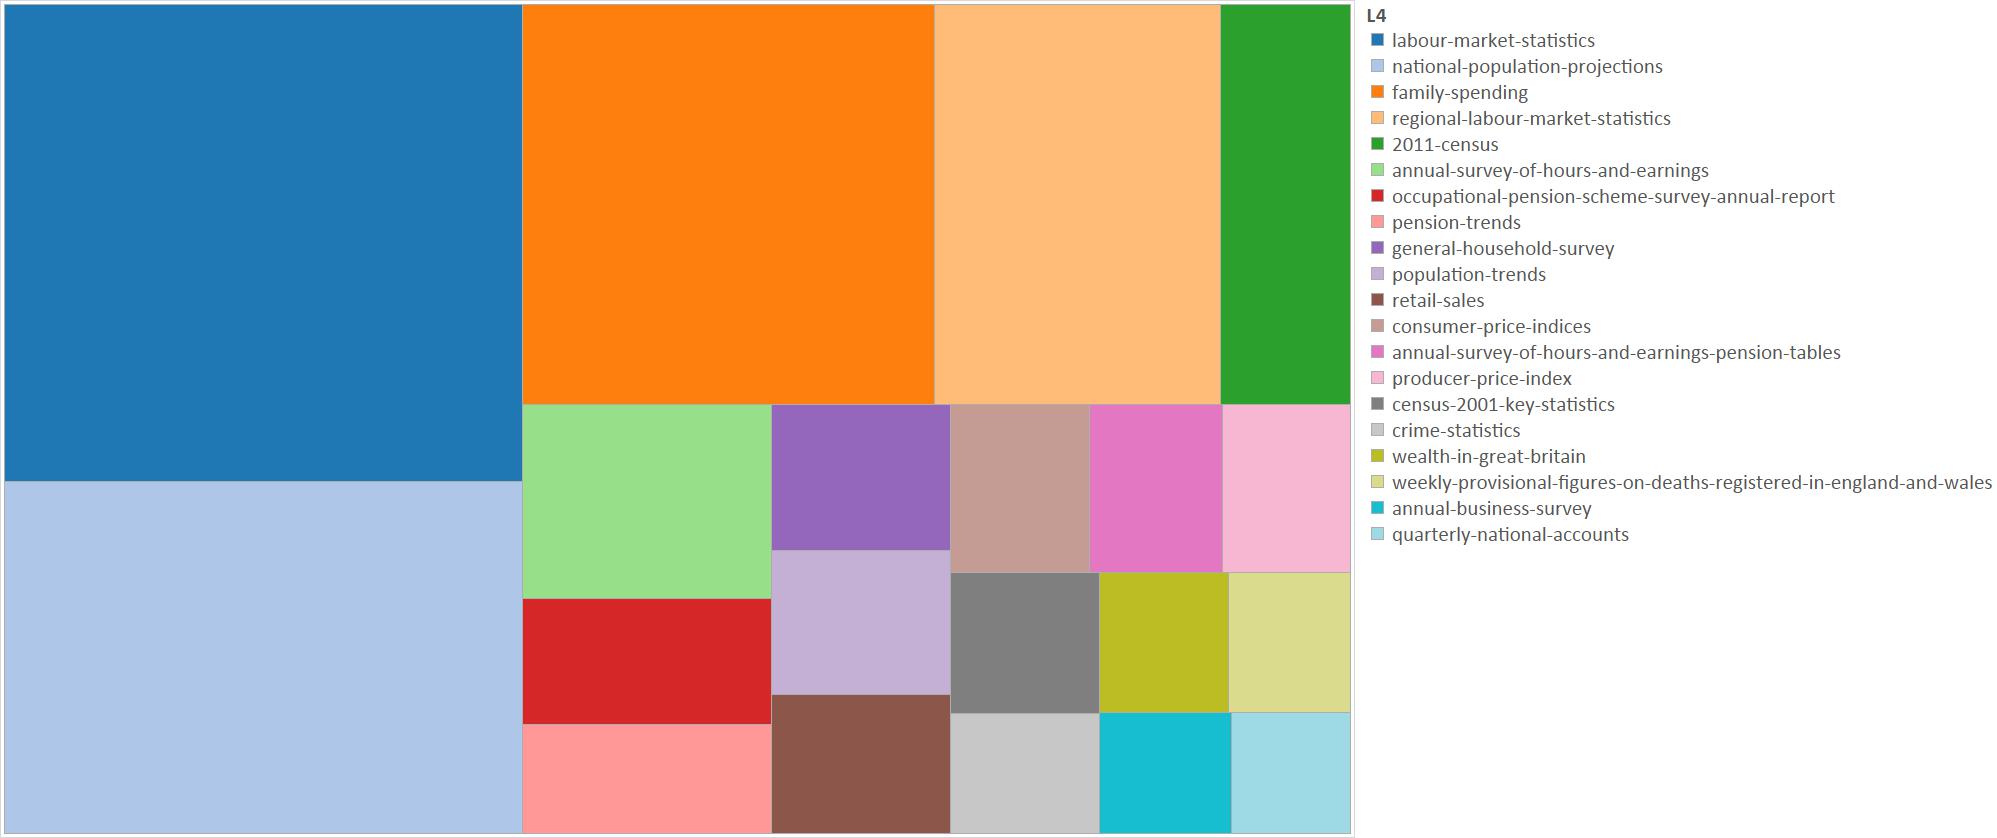
These 20 topics cover approximately the two thirds of the total number of documents.
We can identify file types using the file extension in the URL, this approach needs to be used a little cautiously since sometimes the extension doesn’t match the file type. Most of the files are Excel spreadsheets although there are a few CSV and zip files, the zip files containing Excel spreadsheets. CSV appears to have been used for some of the older datasets. Most of the files are pretty small, less than 290kb but there are a few up to much larger sizes.
Finally we can look at the release dates for the datasets. There are datasets from as far back as 1988, in fact the data set released in 1988 actually refers to data from 1984. There are some data released regularly from about 2001 but from 2011 a wider range of data has been released on a regular basis. We can see the monthly pattern of data releases in this timeline for 2014 which is restricted to the top 20 topics identified above:
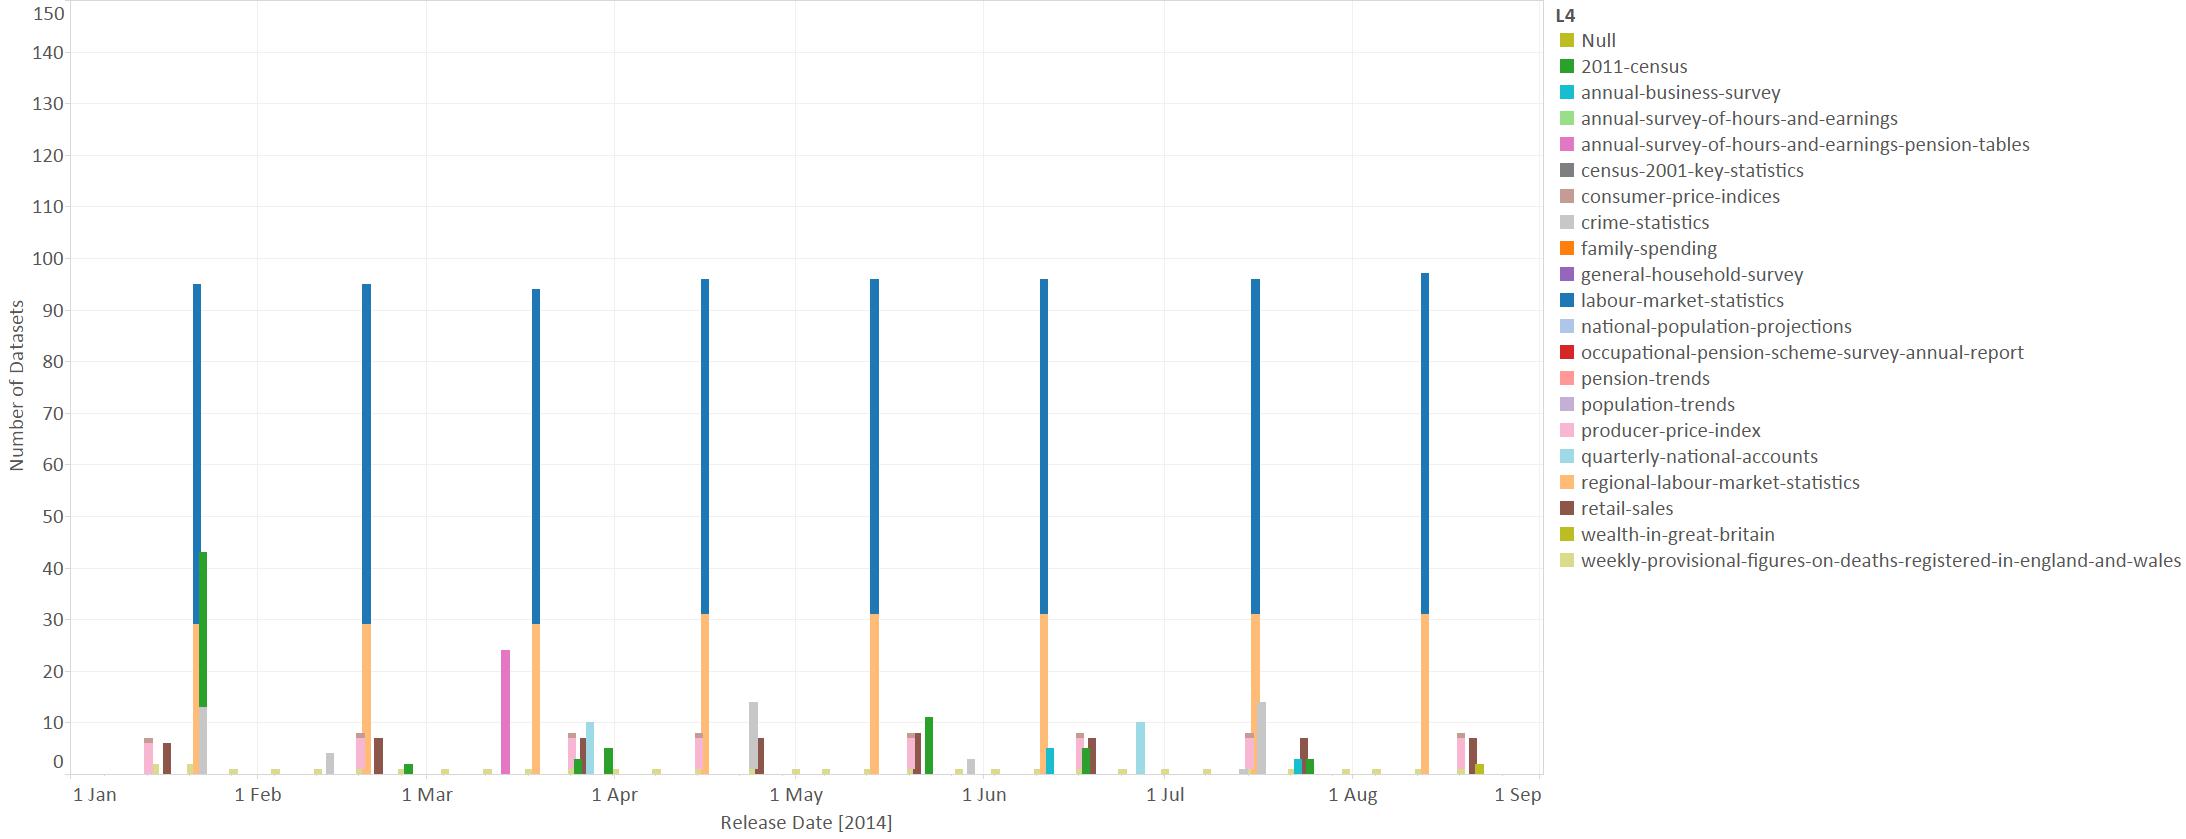
This shows the big releases of labour market statistics, both national and regional, on the third Wednesday of each month. Other monthly releases include retail sales and producer prices data. And every week provisional figures on the registration of deaths in England and Wales are reported.
You can explore these data yourself using the Tableau workbook here.
The actual content of these spreadsheets is another story.
This survey approach to a website is handy for a range of applications, and the techniques used are quite general. We’ve used similar approaches to understand government and newspaper websites.