Number of prescriptions by location
There are 211 clinical commissioning groups (CCG’s) across England dispensing a range of medications every day. These CCG’s have demographic factors that could affect how much medication is dispensed. Therefore I thought it would interesting to compare the number of items dispensed in CCGs across England for a number of different medications, using the Clinical Commissioning Group Prescribing dataset for January – March 2015.
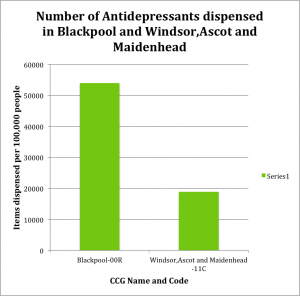
One of the medications I looked at was antidepressant drugs. Figure 1 shows the number of antidepressant drugs dispensed in the Blackpool CCG and the Windsor, Ascot and Maidenhead CCG between January and March 2015. It shows that antidepressant drugs were dispensed almost three times more in Blackpool CCG than Windsor, Ascot and Maidenhead CCG. This is evident as there were 53,986 items per 100,000 people of antidepressant drugs dispensed in Blackpool CCG, whereas there was only 18,898 items per 100,000 people of it dispensed in Windsor, Ascot and Maidenhead. According to research by The Department for Communities and Local Government Blackpool is a poor city as it was part of the 10% most deprived areas in England, while Windsor, Ascot and Maidenhead is described as one the richest areas in England. This may explain why antidepressant drugs are dispensed more in Blackpool CCG than Windsor, Ascot and Maidenhead CCG.
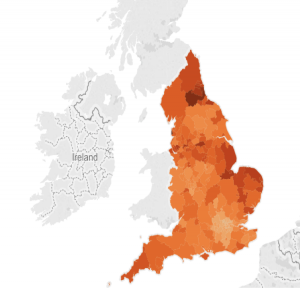
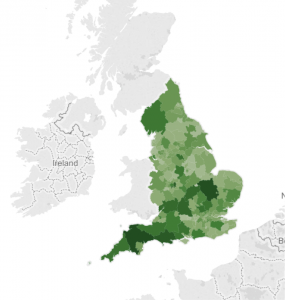
Figure 2a compares the number of items of antidepressants dispensed in CCG’s across England with the population of the CCG’s. The orange map is the number of antidepressants dispensed in CCG’S between January and March 2015. The areas shaded in cream orange dispensed small amount of antidepressants, while the brown areas dispensed large amounts. The green map shows the population of CCG’s in 2012, the areas shaded in light green have smaller populations, while the dark green areas had the highest populations.
Figure 2b shows that the population size of the CCG did not have much effect on the number of antidepressants that were dispensed. This is evident as Cambridgeshire and Peterborough CCG had a population size of 850,073 which was one of the highest populations but it only dispensed 29,502 antidepressants per 100,00 people. It also shows that although Durham Dales, Ealing and Sedgefield CCG does not have a high population size, it dispensed 47,641 antidepressants per 100,000 people, when the highest number of antidepressants dispensed out of all the CCG’s was 53,986 items per 100,000 people. It also shows that generally there were more antidepressants dispensed in the north of England than the south.
Figure 3
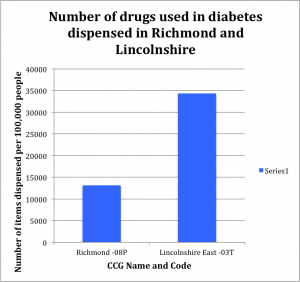
Figure 3 shows the number of drugs used in diabetes dispensed in Richmond CCG and Lincolnshire East CCG between January and March 2012. It shows that Lincolnshire East CCG dispensed over twice as many drugs used in diabetes than Richmond CCG. This is evident as per 100,000 people there were 34,368 items dispensed in Lincolnshire East whereas there was only 13,106 items dispensed in Richmond. According to Public Health England Lincolnshire was worse than the benchmark for excess weight in adults, while Richmond was better than the benchmark. This may affect why there were fewer drugs used in diabetes dispensed in Richmond CCG than in Lincolnshire East CCG as diabetes is often linked to being overweight.
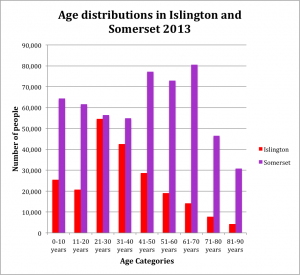
From figures 4 it can be concluded that Islington had a higher proportion of young people than Somerset. This is evident as 25% of Islington’s population was aged 21-30, compared to 10% of Somerset’s population. It also shows that there were more old people in Somerset than Islington as the age group with the highest number of people in Somerset was those aged 61-70. This is evident as 15% of Somerset’s population was in this age category, compared only 7% of Islington’s.
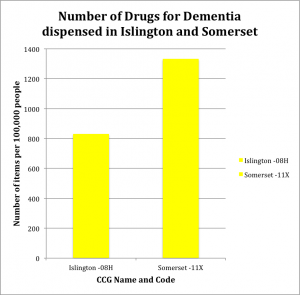
Figure 5 shows the number of drugs for dementia dispensed in Islington CCG and Somerset CCG between January and March 2015. It shows that there were more drugs for dementia dispensed in Somerset than Islington. This is evident as there were 1,333 items per 100,000 people dispensed in Somerset, compared to 831 items per 100,000 people that was dispensed in Islington. There are more old people in Somerset and this may contribute to why there were more drugs dispensed in Somerset than Islington, which has more young people.
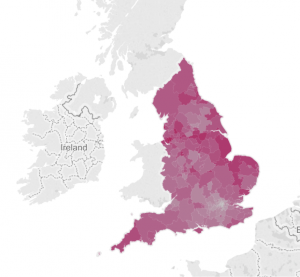
Figure 6 shows the number of items of corticosteroids (Respiratory) dispensed in different CCG’s across England between January and March 2015. The areas shaded in the light grey are where the smallest numbers of corticosteroids (respiratory) that were dispensed, while the areas shaded dark pink dispensed the highest number of items. The map shows that the East of England dispensed large numbers of corticosteroids, especially when compared to areas in and around London. It also shows that Blackpool CCG dispensed the highest number of Corticosteroids (Respiratory) at 16,194 items per 100,000 people, while the smallest number of items was dispensed in Southwark at 4,141 items per 100,000 people.
Conclusion
I found that for many of the drugs the north of England dispensed more than the south of England. It therefore might be argued that the South is generally healthier than the North. I would also conclude from looking at a range of medications that The Durham Dales, Easington and Sedgefield CCG, Lincolnshire CCGs, the Norfolk CCG and the Blackpool CCG are among the unhealthiest CCG’s in England, as they dispensed the highest number of items for many medications.

