The history of Pivot table
A pivot table is a spreadsheet feature that allows data tables to be rearranged in many ways for different views of the same data (pivot from one view to another).
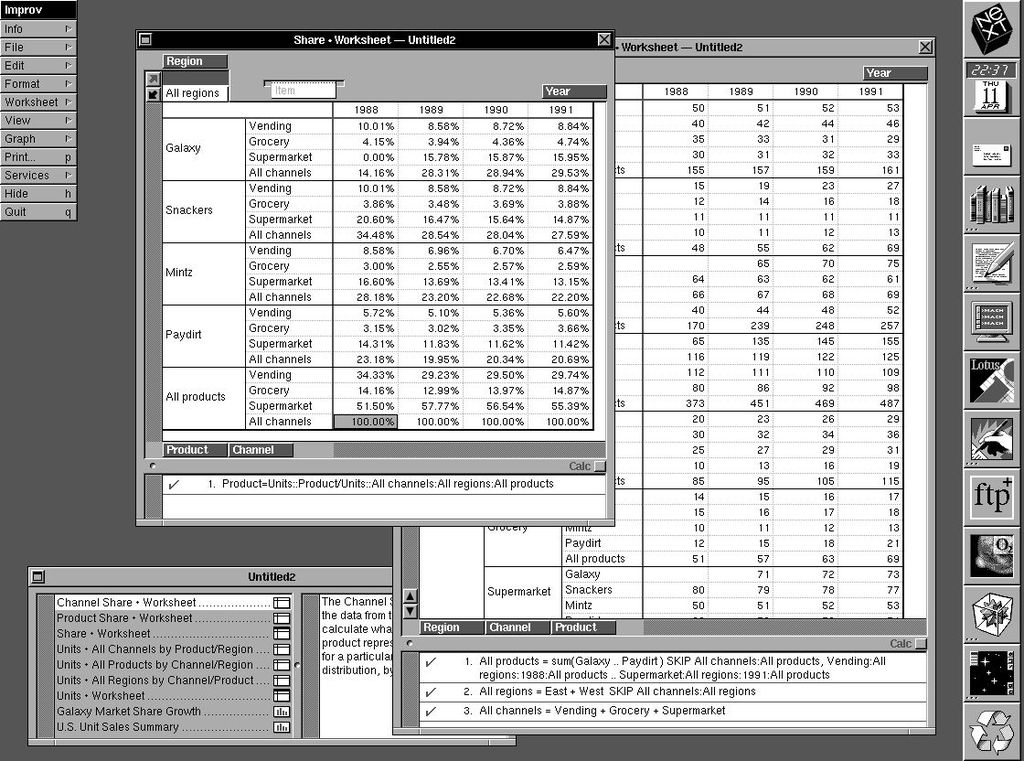
Pivot Tables have become ubiquitous amongst power users of Excel, even being listed as a skill in CVs and a “desirable” in job specifications – but it was not always so. Pivot tables were invented in 1986 by the Father of Pivot Tables Pito Salas who was, at that time, working for Lotus Corp. It didn’t see the light of day until 5 years later when Lotus Improv was released for the NeXT platform in 1991.
The Lotus team found development on OS/2 was difficult. They switched to NeXTSTEP, resulting in ‘truckloads’ of flowers from Steve Jobs.
One of the revolutionary things about Lotus Improv was that users could utilise it to define and store sets of categories and then change views by dragging category names with their mouse. This functionality provided the core model for the pivot table feature that is commonly used today.
Pivot Tables can cause problems for data hubs, and people wanting programmatic access to data. This is because the data isn’t “flat” and database-like. For Tableau, it’s a big enough problem that they have specific advice on how to prepare your Excel files.
It’s sad that Improv has died, but it provided the childhood home for Pivot Tables, which now live on in Excel (since 1993, when Microsoft Excel 5 was launched), and Tableau.
Nice potted history! Improv-style analysis also lives on in a product called Quantrix Modeller (with which I am not associated, other than as a onetime occasional user, though no longer, as it’s quite expensive).