600 Lines of Code, 748 Revisions = A Load of Bubbles
 When Channel 4’s Dispatches came across 1,100 pages of PDFs, known as the National Asset Register, they knew they had a problem on their hands. All that data, caged in a pixelated prison.
So ScraperWiki let loose ‘The Julian’. What ‘The Stig’ is to Top Gear, ‘The Julian’ is to ScraperWiki. That and our CTO.
‘The Julian’ did not like the PDFs. After scraping 10 pages of Defence assets, he got angry. The register may as well been glued together by trolls. The 5 year old data copied and pasted by Luddites from the previous Government was worse then useless.
So the ScraperWiki team set about rebuilding the register. Using good old-fashioned man power (i.e. me) and a PDF cropper we built a database of names, values and hierarchies that link directly to the PDFs.
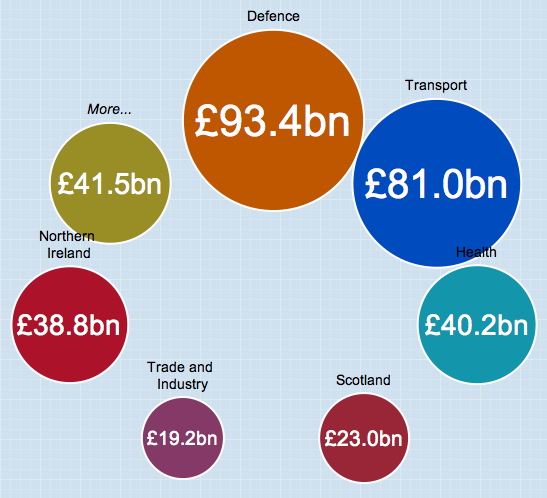
Then Julian set about coding; 600 lines and 748 revisions! He made the bubbles the size of the asset values and got them to orbit around their various parent bubbles. This required such functions as ‘MakeOtherBranchAggregationsRecurse(cluster)’.
This scared our designer Zarino a little, who nevertheless made it much more user-friendly. This is where ScraperWiki’s powers of viewing live edits, chatting and collaboration became useful. The result was rounds of debugging interspersed with a healthy dose of cursing.
We then tried using it. We wanted the source of the data to hold provenance. We wanted to give the users the ability to explore the data. We wanted them to be able to see the bubbles that were too small. We prodded ‘The Julian’.
 He hard coded the smaller bubbles to get into a ‘More…’ bubble orbit. This made the whole article on Channel 4 News thing a lot clearer and changed the navigation from jumping to orbits to drilling down and finding out which assets are worth a similar amount.
He then got it to drill down to the source PDFs. ‘The Julian’ outdid himself and stayed up all night making a PDF annotator of the data. We have plans for this.
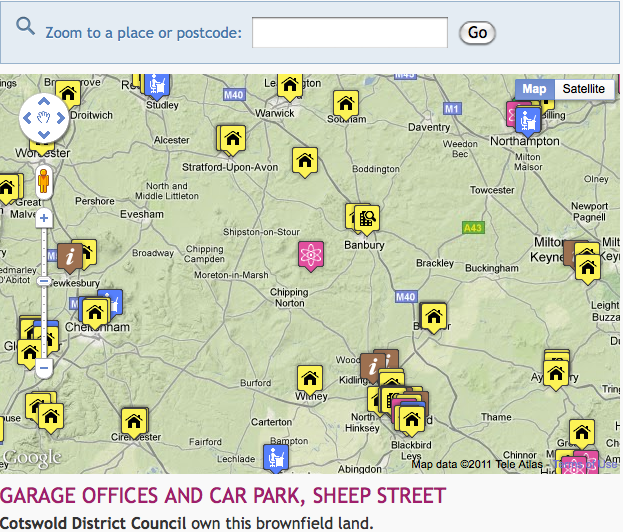
Oh, and we also made a brownfield map on the Channel 4 News site. The scraper can be found here. And the code for the visual here. The 25000 data points were in Excel form and so much easier to work with. This was nice data with lots of fields. The result: a very friendly application that allows users to type a post code and to see what land their local authority has up for redevelopment. But due to the new government coming in, the Homes and Communities Agency have not yet finished collecting the 2009 data.
NAR and NLUD – you’ve been ScraperWikied!

Is there an explanation anywhere of the PDF cropper? I’ve seen it a few times from the Dispatches data, but the pages doesn’t give much explanation. I assume it’s only been used internally so far.
Now I feel a bit silly after finding the ‘Instructions’ bit. I guess I was mostly wondering if it could also do OCR, but the pdf annotator seems to be the tool for actually extracting information.
The cropper and annotator are new features just rolled out. We’re testing to see what is most useful. Those that are will be made much more user-friendly. Our goal is to make unstructured data more usable but also much more explorable. Sadly, the data as it is collected, has very little information attached. Hopefully with exposure it will be collected in a much more usable manner