What Does It All Mean? Find out with Summarise This Data
Every time I generate a new dataset, the first thing I want is a high-level overview of what’s going on. I can’t digest millions of individual rows of data – I need a way to zoom-out and get the bigger picture of what’s going on.
Take the table below which shows all the National Trust properties of England and Wales. Although it’s a tiny dataset – there are only around 500 entries – there are already questions I can’t answer.
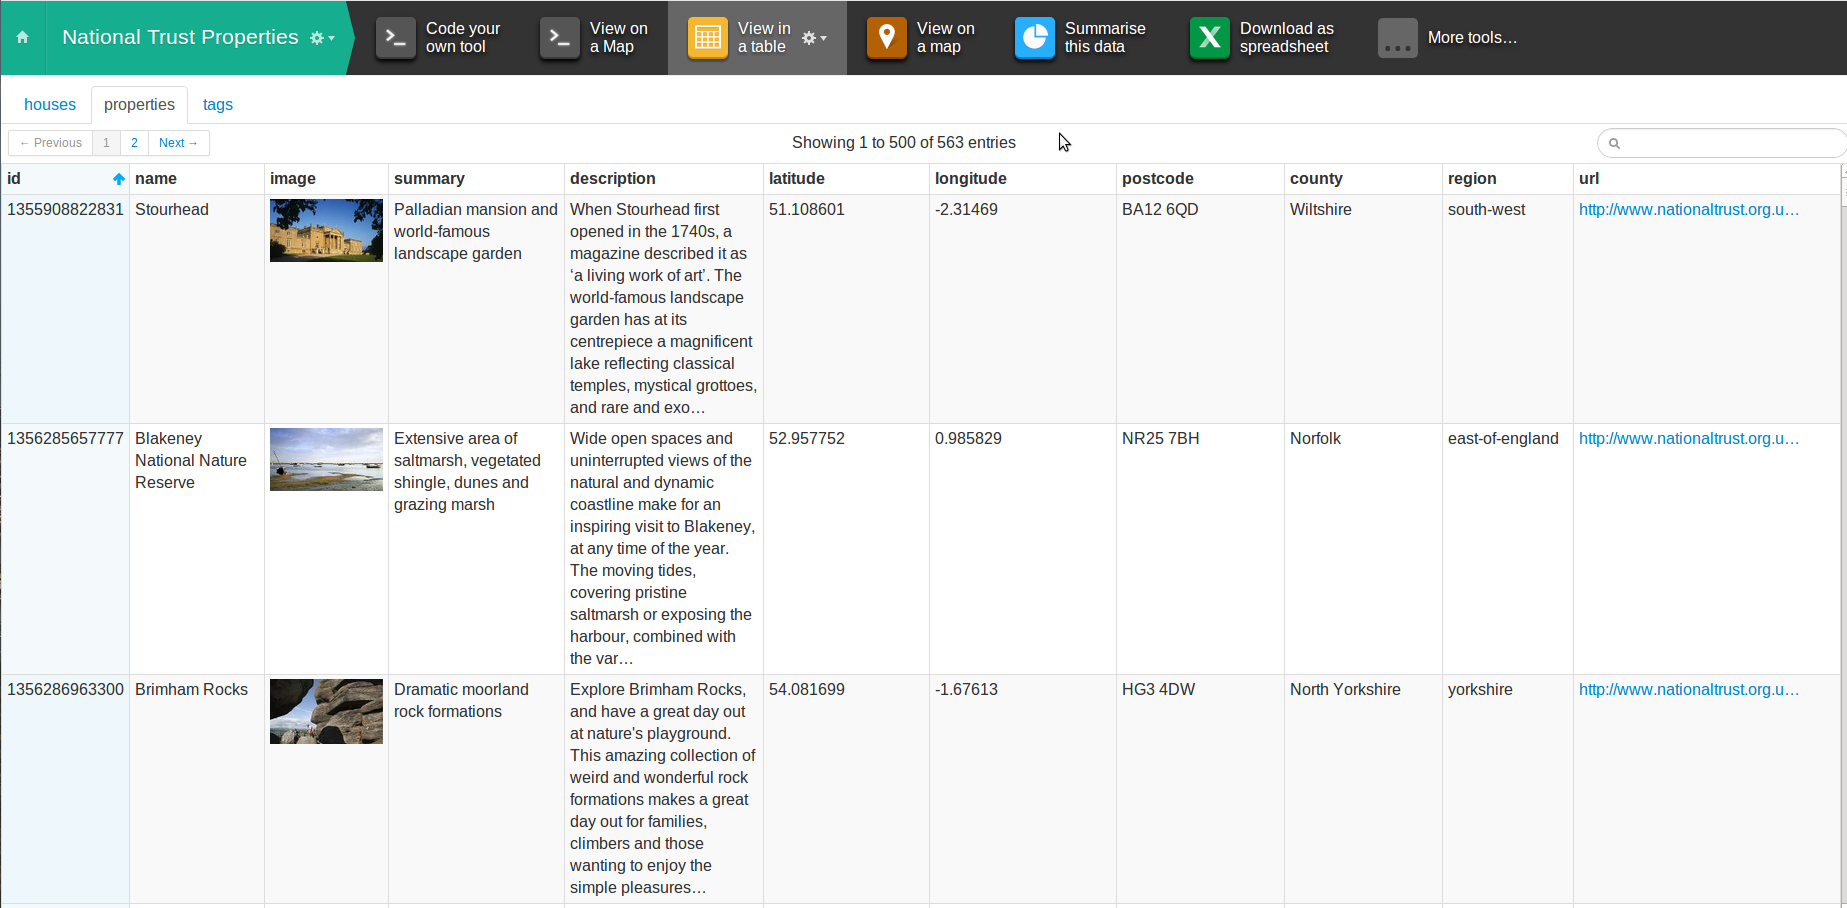
Suppose I want to plan my next camping holiday and I have a particular penchant for Elizabethan properties (this is not inaccurate). I want to know where to go – which counties have the most properties, and is there any mention of 16th/17th century?
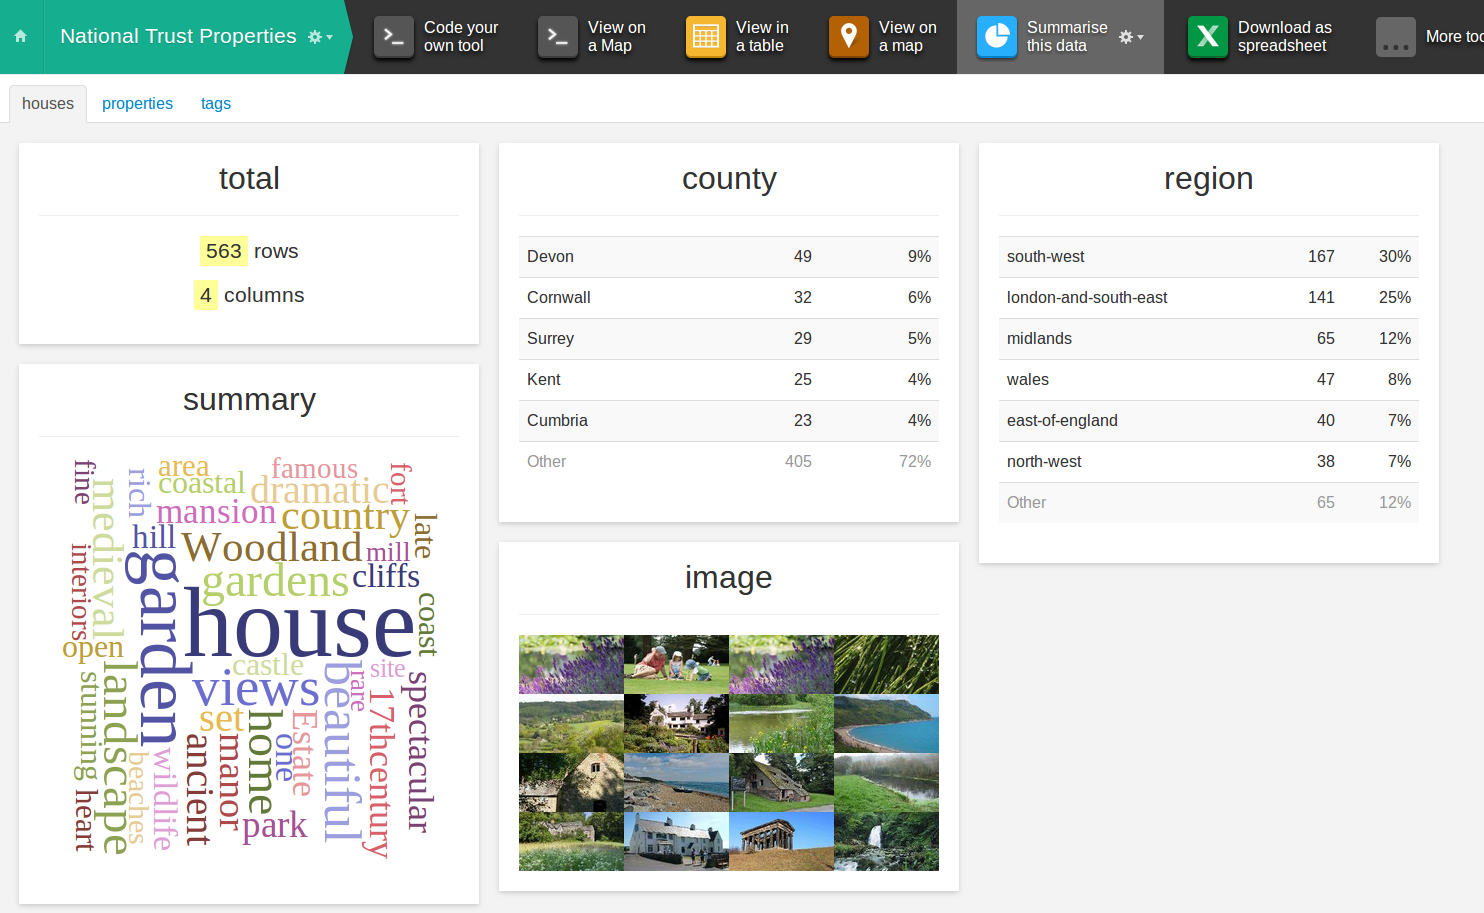
That’s where the Summarise This Data tool comes in. The overview below makes it immediately obvious that the majority of properties are in the South-West, particularly Devon. The wordle on the summary column shows prominent words like house, garden, beautiful, woodland, views – the relative size suggests that there are more houses than gardens (although many houses will also have gardens, so further investigation is required). I can even see a “17th century” at the bottom right of the wordle – a good start!
For each column in every table, the tool makes some informed guesses about the type of data it’s looking at, for example a postcode, an image, a description and so on. This helps it choose the most appropriate type of summary box to display.
In my day-to-day work as a Data Scientist, the tool helps me verify that the data looks sensible (highlighting any errors in the scraping or conversion stages) and understand what the data means. This is an essential activity before doing any serious number crunching.
Let’s see how it works on some other data – why not try it out with our Twitter search tool? First, log in to https://scraperwiki.com and click Create a new dataset. Select Search for tweets and follow the instructions.
Let’s pretend you’re a javascript developer looking for a job – we’re going to search for “hiring javascript” then click Summarise this data.
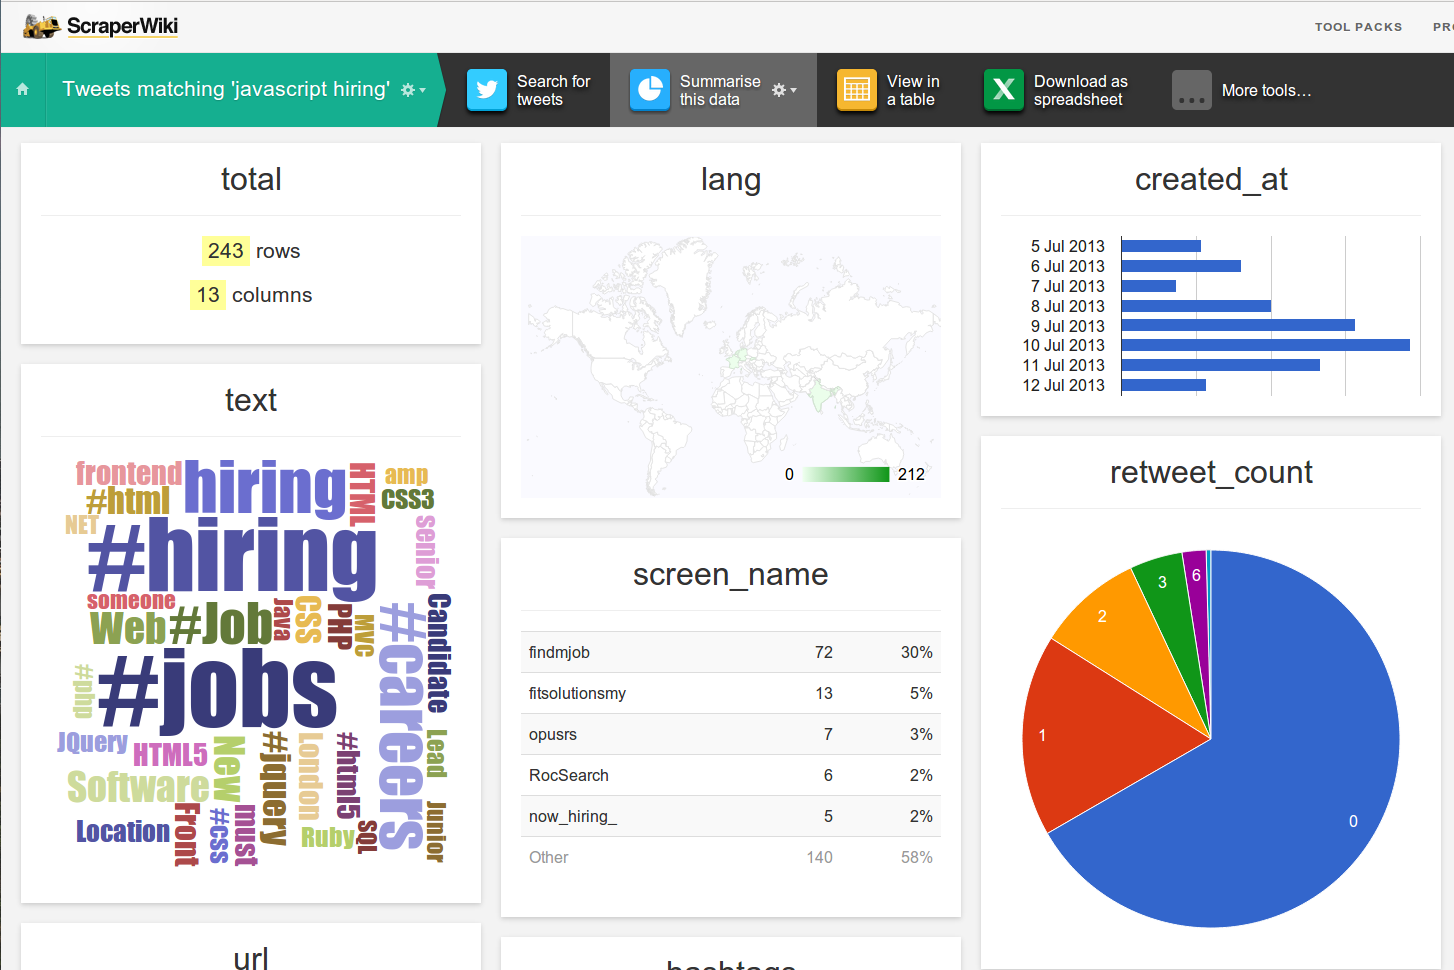
A couple of things jump out straight away:
- The majority of tweets are from findmjob – probably some sort of recruiter or job listing site. It might be valuable to look into them directly, or indeed filter them out by adding “-findmjob” to the search.
- The words jQuery, HTML, CSS are appearing in searches too (predictably) so it might be worth expanding the search to eg “(javascript OR jQuery OR HTML) hiring”
- There aren’t very many tweets – it will probably more interesting as the dataset automatically grows over time.
We’ve seen how the Summarise tool gives you insights to two completely different datasets. Its beauty lies in the fact that it doesn’t try to understand the data; it just presents the data in a helpful format.
What really strikes me, however, is how effortless it is to get started with the tool. No dependencies, no software installation, no data import & export – once you’ve stored something in your dataset, it just works.
Trackbacks/Pingbacks
[…] Summarise Automatically tool gives you a quick view of any dataset, making a guess at how best to show the data. For example, a […]
[…] example, using the “Summarise this data” tool, this is what the people who follow @samuelpepys are into in their Twitter […]