The BIG Lottery Data
 The UK’s BIG Lottery Fund recently released its grant data since 2004 as a set of lovely CSV files: You can get it yourself here or here. I found it a great opportunity to try out some new tricks with Tableau, and have a bit of a poke around another largish dataset from government. The data runs to a little under 120,000 lines.
The first question to ask is: where is all the money going?
The total awarded is £5,277,058,180 over nearly 10 years. It’s going to 81,386 different organisations. The sizes of grants vary enormously; the biggest, £214,340,846, going to the Big Local Trust, which is an umbrella organisation. Other big recipients include the Royal Society of Wildlife Trusts, who received £59,842,400 for the Local Food programme. The top 10 grants are listed below:
| 01/03/2012, Big Local Trust | £ 214,340,846 |
| 15/08/2007, Royal Society of Wildlife Trusts | £ 59,842,400 |
| 04/10/2007, The Federation of Groundwork Trusts | £ 58,306,400 |
| 13/05/2008, Sustrans Limited | £ 49,980,908 |
| 11/10/2012, Life Changes (Trustee) Limited | £ 49,338,186 |
| 13/12/2011, Forces In Mind Trustee Limited | £ 34,808,423 |
| 19/10/2007, Natural England | £ 30,113,200 |
| 01/05/2007, Legacy Trust UK Limited | £ 28,850,000 |
| 31/07/2007, Sustrans Limited | £ 25,023,084 |
| 09/04/2008, Falkirk Council | £ 25,000,000 |
Awards like this make determining the true geographic distribution of grants a bit tricky, since they are registered as being awarded to a particular local area – apparently the head office of the applicant – but they are used nationally. There is a regional breakdown of where the money is spent but this classification is to large areas i.e. “England” or “North West”. The Big Local Trust, Life Changes and Forces in Mind are all very recently established – less than a couple of years old. The Legacy Trust was established in 2007 to fund programmes to promote an Olympic legacy.
These are really big grants, but what does the overall distribution of awards look like?
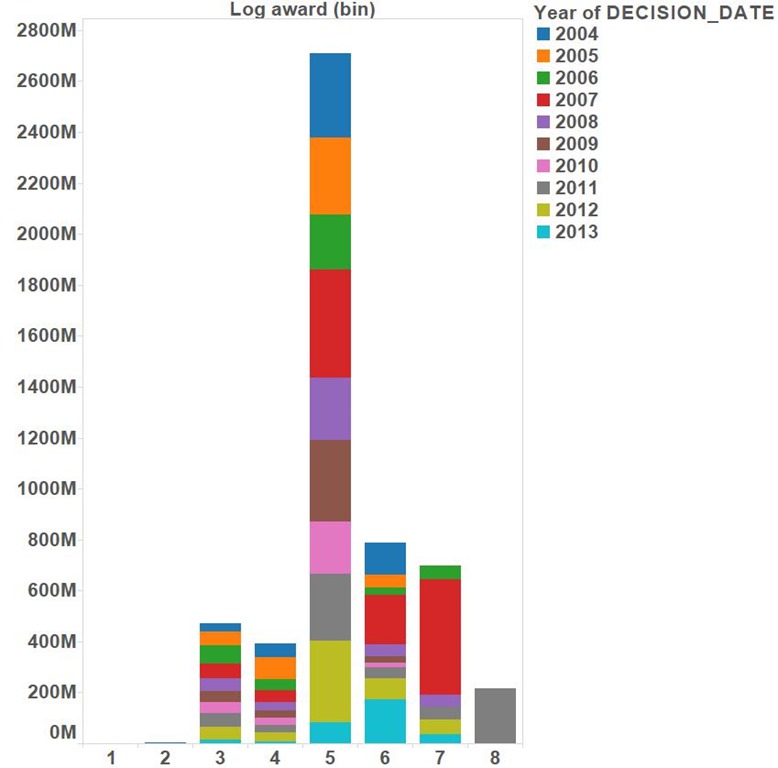
This is shown in the chart below:
It’s a bit complicated because the spread of award sizes is from about £1000 to over £100,000,000 so what I’ve done is taken the logarithm of the award to create the bins. This means that the column marked “3” contains the sum of all awards from £1000 to £9999 and that marked “4” contains the sum of all awards from £10,000 to £99,999. The chart shows that most money is distributed in the column marked “5”, i.e. £100,000 to £999,999. The columns are coloured by the year in which money was awarded, so we can see that there were large grants awarded in 2007 as well as 2011 and 2013.
Everybody loves a word cloud, even though we know it’s not good in terms of data visualisation, a simple bar chart shows the relative frequency of words more clearly. The word cloud below shows the frequency of words appearing in the applicant name field of the data, lots of money going to Communities, Schools, Clubs and councils.
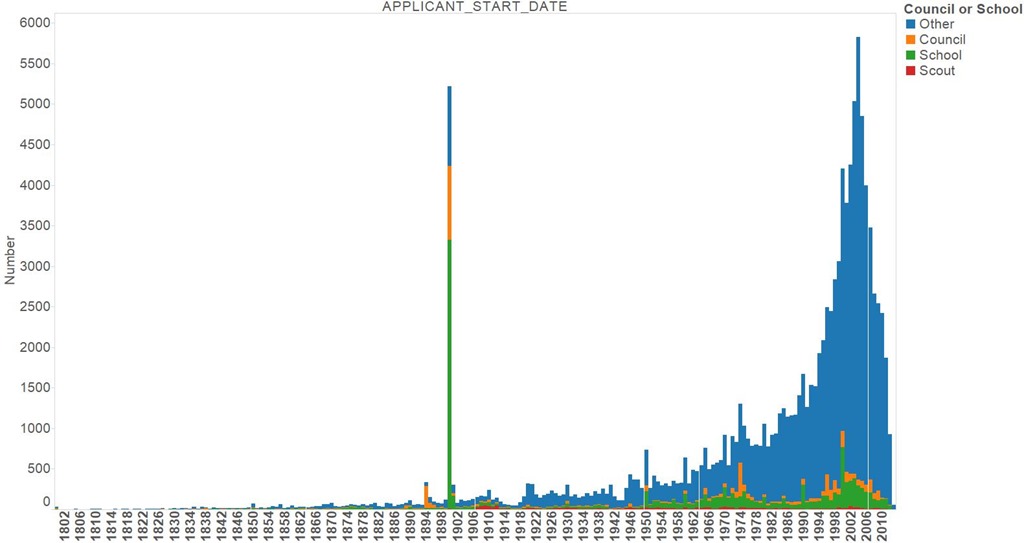
The data also include the founding date for the organisations to which money is awarded, most of them were founded since the beginning of the 20th century. There are quite a few schools and local councils in the list and, particularly for councils we can see the effect of legislation on the foundation of these organisations, there are big peaks in founding dates for councils in 1894 and in 1972-1974, coinciding with a couple of local government acts. There’s a dip in the foundation of bodies funded by the BIG lottery for both the First and Second World Wars, I guess people’s energies were directed elsewhere. The National Lottery started in the UK in late 1994.
As a final piece of analysis I thought I’d look at sport; I’m not particularly interested in sport so I let natural language processing find sports for me in applicant names – they are often of the form “Somewhere Cricket/Rugby/Tennis/etc Club”. One way of picking out all the sports awards would be to come up with a list of sports names and compare against that list but I applied a little more cunning: the nltk library will tell you how closely related two words are using the WordNet lexicon which it contains. So I identified sports by measuring how closely related a target word was from the word “sport”. This got off to a shaky start since I decided to use “cricket” as a test word; “cricket” is as closely related to “sport” as “hamster” – a puzzling result until I realised that the first definition of “cricket” in WordNet relates to the insect! This confusion dispensed with finding all the sports mentioned in the applicant names was an easy task. The list of sports I ended up with was unexceptional.
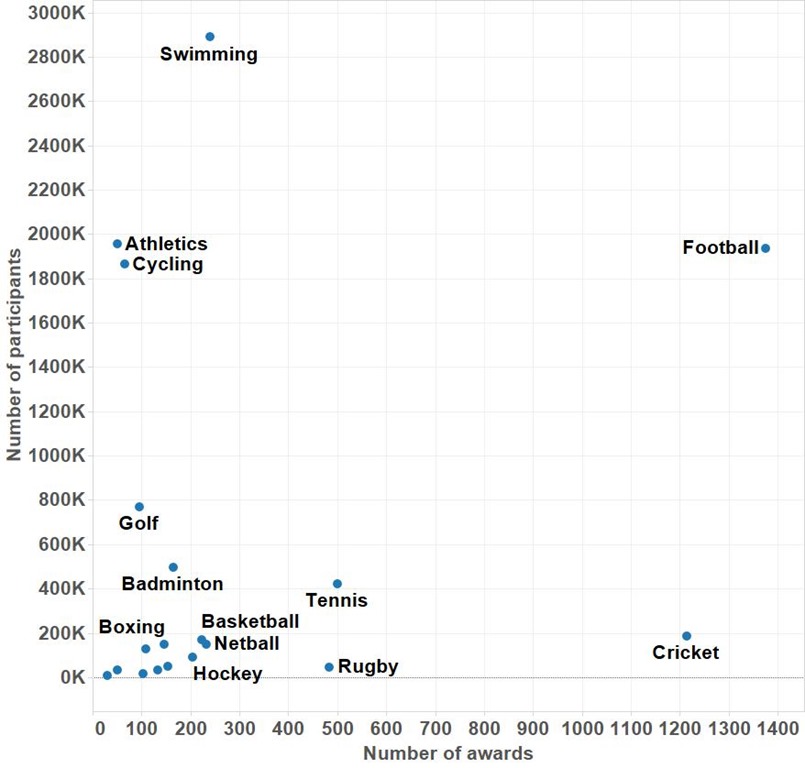
You can find participation levels in various sports here, I plotted them together with numbers of awards. Sports near the top left have relatively few awards given the number of participants, whilst those bottom right have more awards than would be expected from the number of participants.
You can see interactive versions of these plots, plus a view more here on Tableau Public.
That’s what I found in the data – what would interest you?
Footnotes
I uploaded the CSV files to a MySQL database before loading into Tableau, I also did a bit of work in Python using the pandas library. In addition to the BIG lottery data I pulled in census data from the ONS and geographic boundary data from Tableau Mapping. You can see all this unfolding on the bitbucket repo I set up to store the analysis. Since Tableau workbook files are XML format they can be usefully stored in source control.


