Digitally enhanced social research
Guest post by Dr Rebecca Sandover.
The continued expansion of social media activity raises many questions of how this ever-changing digital life spreads ideas and how ‘contagious’ online events arise. Exeter University’s Contagion project has been running since September 2013, funded by the UK Economics and Social Research Council to explore how such events spread in several spheres. Presently the focus of the project is to develop methods for conducting research around ‘contagious’ or ‘viral’ online social interactions. The aim is to discern the environments from which spikes of activity arise and to investigate these spikes in order to further understanding of online social activity.
The team involved in the project are human geographers mostly with backgrounds in research significantly informed by social theory. Therefore the key aims of the project are to compliment the insights of social theory with capabilities of data analysis and to develop a toolbox of methods that other social scientists could adapt. We’re keen to stress our novice status in the field of data science and user-friendly platforms such as Scraperwiki are powering our investigations, enabling us to specify data searches, manipulate data and output those data in ways that are intuitive and easily developed. Tools such as Scraperwiki, Google Refine, Gephi and BASE enabled us to be up and running with our investigations once the project began.
On starting the project we ran a pilot study on social media activity around the badger cull in the UK last year. Like similar research we have decided to concentrate on Twitter data as it contains publically accessible data. By analysing the cull through various hashtags we have begun to identify formations of online communities, interactions of influencers and the intersections of conventional and burgeoning media in shaping the responses to the events. It certainly helps to enliven research when events go viral, such as the moment when the badgers were suggested to have ‘moved the goalposts’. Spikes like this show social media at its best, responsive, inventive and creating humour out of tense situations.
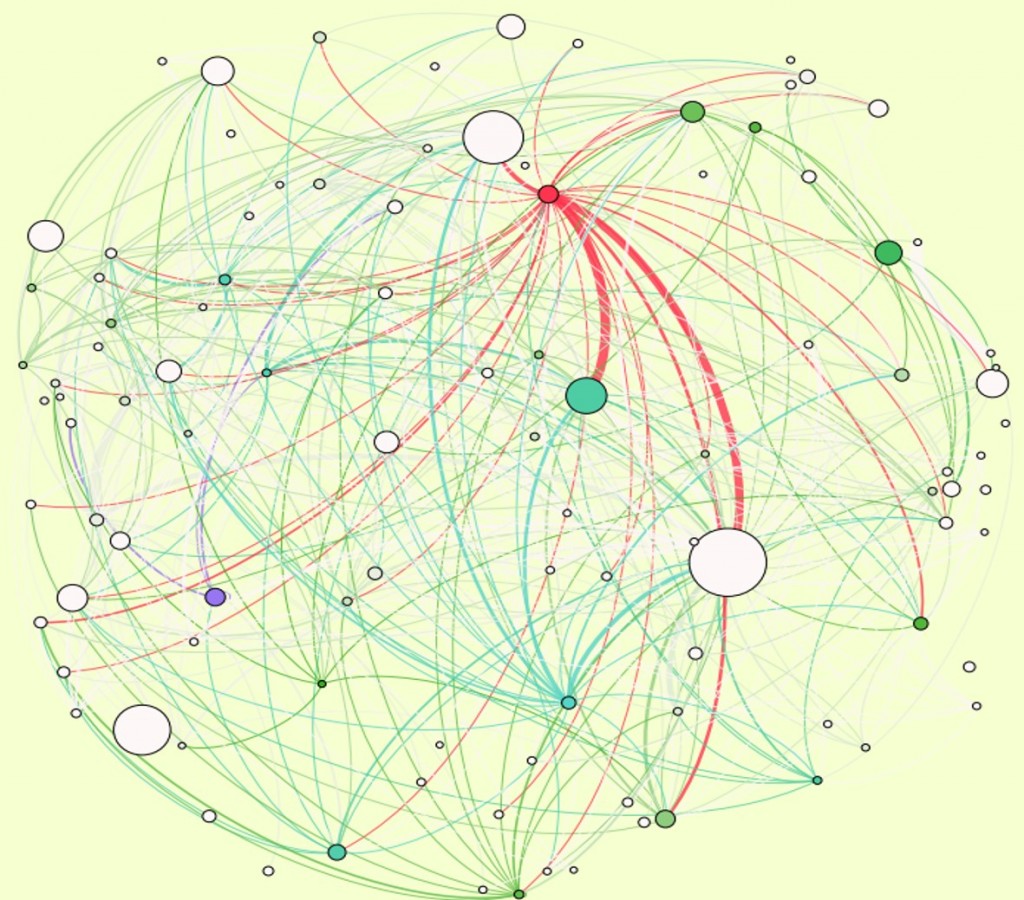
Through the pilot study we have been able to acquaint ourselves with the open access tools mentioned above to develop different approaches to analysing the data emerging from the event. Using Google Refine to clean complex and messy data and Gephi to represent the data spatially and graphically we have created visual representations of social networks interacting on Twitter. Combining Open Office BASE with data from Scraperwiki has allowed us to develop SQL queries to interrogate patterns emerging from the data. For example, this has included drawing out data for time series graphs to identify peaks of activity. The broad-based social sciences backgrounds of the team motivates an investigation beyond the numbers to explore as fully as we can social frameworks feeding these events through various online and offline factors. This experimental and mixed-methods approach will be reflected in forthcoming research papers and conference presentations to explore these methods for ‘scraping the social’ (Marres & Weltevrede 2013), which we will share through the project website.


