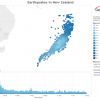
A guest post from Jyl Djumalieva. During February and March this year I had a wonderful opportunity to share the workspace with ScraperWiki team. As an aspiring data analyst, I found it very educational to learn how real-life data science happens. After observing ScraperWiki data scientist do some analytical heavy lifting I was inspired to embark […]

Inordinately fond of beetles… reloaded!
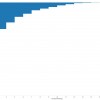
Some time ago, in the era before I joined ScraperWiki I had a play with the Science Museums object catalogue. You can see my previous blog post here. It was at a time when I was relatively inexperienced with the Python programming language and had no access to Tableau, the visualisation software. It’s a piece […]

GeoJSON into ScraperWiki will go!
Surely everyone likes things on maps? Driven by this thought we’re produced a new tool for the ScraperWiki Platform: an importer for GeoJSON. GeoJSON is a file format for encoding geographic information. It is based on JSON which is popular for web based APIs because it is light weight, flexible and easy to parse by […]

Getting all the hash tags, user mentions…
We’ve rolled out a change so you get more data when you use the Twitter search tool! We’ve changed four columns. They used to all just randomly return one thing. Now they return all the things, separated by a space. The columns are: hashtags now returns all of them with the hashes, e.g. #opendata #opendevelopment user_mention has […]
Our new US stock market tool
In a recent blog post, Ian talked about getting stock market data into Tableau using our Code in a Browser tool. We thought this was so useful that we’ve wrapped this up into an easy-to-use tool. Now you can get stock data by pressing a button and choosing the stocks you’re interested in, no code […]

The London Underground: Should I walk it?
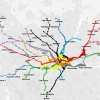
With a second tube strike scheduled for Tuesday I thought I should provide a useful little tool to help travellers cope! It is not obvious from the tube map but London Underground stations can be surprisingly close together, very well within walking distance. Using this tool, you can select a tube station and the map […]
Try out the Tableau and QlikView connector
In March, we launched an OData tool. If you use Tableau or QlikView, it lets you easily get and refresh data from ScraperWiki. From today, the OData tool is now available on our new 30 day trial accounts. Which means anyone can try it out for free! Instructions here (particularly for Tableau).

Visualising the London Underground with Tableau
I’ve always thought of the London Underground as a sort of teleportation system. You enter a portal in one place, and with relatively little effort appeared at a portal in another place. Although in Star Trek our heroes entered a special room and stood well-separated on platforms, rather than packing themselves into metal tubes. I […]

Yahoo!Finance to Tableau via ScraperWiki
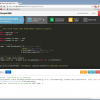
Our recently announced OData connector gives Tableau users access to a world of unstructured and semi-structured data. In this post I’d like to demonstrate the power of a Python library, Pandas, and the Code in a Browser tool to get “live” stock market data from Yahoo!Finance into Tableau. Python is a well-established programming language with […]
Publish your data to Tableau with OData
We know that lots of you use data from our astonishingly simple Twitter tools in visualisation tools like Tableau. While you can download your data as a spreadsheet, getting it into Tableau is a fiddly business (especially where date formatting is concerned). And when the data updates, you’d have to do the whole thing over […]
