Summarise #3: Buckets of time and numbers
In the last two weeks I introduced the “Summarise automatically tool”, which magically shows you interesting facts about any dataset in the new ScraperWiki.
It’s an open source tool – geeks can play along on Github, or use the SSH button to log into the tool and see the code running in action.
After adding pie charts, I realised that even for general data lots of columns had basic types in them which could be easily detected, and special visualisations shown. For example, dates and times or image URLs.
For a while now, I’ve been using Pocket (formerly Read It Later) to bookmark articles and videos to read or watch later. I’ve got a scraper that calls the Pocket API (get in touch if you’d use it and want me to release it as a tool!) and saves all my bookmarks as a dataset.
This is a histogram the “Summarise automatically” tool made of when I added bookmarks.
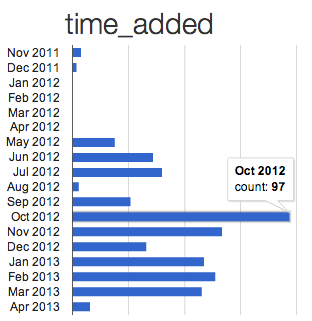
You can immediately see I first tried out Pocket a tiny bit in November/December 2011, but then stopped using it for four months. Then in May 2012, I start again in earnest. That was because I’d got a new smartphone with a larger screen, and wanted to read articles on the train. You can also see I went on holiday in August 2012, and didn’t bookmark much then.
The code that automatically made this chart is in the “fact_time_charts” function in facts.js. First of all it uses the fantastic moment.js library to parse every value in the column. If at least half of them appear to be dates/times, it goes ahead and makes a time histogram.
The interesting bit is when it tries various ways to “bucket” (or “bin”) the data. That is, count the number of times something in the columns is in a particular hour, data, month or year. It tries out all four, and only uses the chart that has fewer than 31 rows.
// try grouping into buckets at various granularities

_bucket_time_chart(col, group, "YYYY", "years", "YYYY", "time_chart_year", 90)

_bucket_time_chart(col, group, "YYYY-MM", "months", "MMM YYYY", "time_chart_month", 91)

_bucket_time_chart(col, group, "YYYY-MM-DD", "days", "D MMM YYYY", "time_chart_day", 92)

_bucket_time_chart(col, group, "YYYY-MM-DD HH", "hours", "ha D MMM YYYY", "time_chart_hour", 93)
This means if the data is spread out over lots of years, it will show it by year. If it all happened in one day, it’ll show a histogram by hour.
The “Summarise automatically” tool does a similar thing for columns of numbers. It shows a histogram so you can see how they are distributed. For example, this chart was made automatically for a Climate Code Foundation dataset of sea temperature station observations.

“Z” is the relative height of the sea. You can see there are two peaks in the histogram where lots of observations were made – one is for low tide and the other for high tide.
Once again this puts the data points into bins of different sizes to make the histogram. This time it does a logarithm to find the power of 10 to use as the width for each bar that means there are a reasonable number of bars – as near to 33 as possible. The code for this is in “fact_numbers_chart” in facts.js.
A notable bit works out if the histogram “looks interesting”. We had lots of them that only showed one bar, because a few outliers were far off the edge. The test in the end was to look at the second most common value, and see if it is at least the sqrt of the number of rows. This means the bar charts are at least slightly interesting – it falls back to tables of the top values if they’re not.
 // if the second most common value is at least the sqrt of the number of rows

if (group[1].c < Math.sqrt(total) ) {

return

}
Try it yourself! Use “create a dataset” to get some data into ScraperWiki. Then pick “Summarise automatically” from the tools menu and see what it tells you.
Next time, I add fancy stuff to display URLs.
Trackbacks/Pingbacks
[…] been teasing and tempting you with blog posts about the first few tools on the new ScraperWiki Beta for a while now. […]