We hear a lot about “Big Data” at ScraperWiki. We’ve always been a bit bemused by the tag since it seems to be used indescriminately. Just what is big data and is there something special I should do with it? Is it even a uniform thing? I’m giving a workshop on data science next week and […]

GeoJSON into ScraperWiki will go!
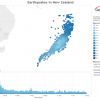
Surely everyone likes things on maps? Driven by this thought we’re produced a new tool for the ScraperWiki Platform: an importer for GeoJSON. GeoJSON is a file format for encoding geographic information. It is based on JSON which is popular for web based APIs because it is light weight, flexible and easy to parse by […]
NewsReader World Cup Hack Day
A long time ago*, in a galaxy far, far away** we ran the NewsReader World Cup Hack Day. *Actually it was on the 10th June . **It was in the Westminster Hub, London. NewsReader is a EU FP7 project aimed at developing natural language processing and Semantic Web technology to make sense of large streams […]
World Cup Hack Day, London 10th June – a teaser!
With the England team just arrived in Miami for their final preparations for the World Cup, Mohammed Bin Hammam is back in the news for further accusations of corruption. This is interesting because we saw Hammam’s name on Friday as we were testing out the NewsReader technology in preparation for our Hack Day in London […]
Book review: Learning SPARQL by Bob DuCharme
The NewsReader project on which we are working at ScraperWiki uses semantic web technology and natural language processing to derive meaning from the news. We are building a simple API to give access to the NewsReader datastore, whose native interface is SPARQL. SPARQL is a SQL-like query language used to access data stored in the […]
Connecting QlikView to ScraperWiki with OData
This is a guest post by Nuno Faustino who shows how to connect QlikView to ScraperWiki using our new Odata connector. The first step is to collect some data using the ScraperWiki Platform, the demonstration here uses the our new US Stock Market data tool but could equally well have used the Twitter Follower or Twitter […]
Hiding invisible text in Table Xtract
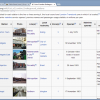
As part of the my London Underground visualisation project I wanted to get data out of a table on Wikipedia, you can see it below. It contains data on every London Underground station including things like the name of the station, the opening date, which zone it is in, how many passengers travel through it […]
The London Underground: Should I walk it?
With a second tube strike scheduled for Tuesday I thought I should provide a useful little tool to help travellers cope! It is not obvious from the tube map but London Underground stations can be surprisingly close together, very well within walking distance. Using this tool, you can select a tube station and the map […]
Book review: Data Science for Business by Provost and Fawcett
Marginalia are an insight into the mind of another reader. This struck me as a I read Data Science for Business by Foster Provost and Tom Fawcett. The copy of the book had previously been read by two of my colleagues. One of whom had clearly read the introductory and concluding chapters but not the […]
Visualising the London Underground with Tableau
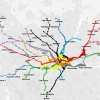
I’ve always thought of the London Underground as a sort of teleportation system. You enter a portal in one place, and with relatively little effort appeared at a portal in another place. Although in Star Trek our heroes entered a special room and stood well-separated on platforms, rather than packing themselves into metal tubes. I […]