Data analysis using the Query with SQL tool

Ferdinand Magellan, the Renaissance’s most prodigious explorer. He almost certainly knew lingua franca – but did he know SQL?It’s Summer 1513. Rome is the centre of the Renaissance world, and Spanish, Italian, and Portuguese merchant ships criss-cross the oceans, ferrying textiles from the North, spices from the East, and precious metals from the newly-discovered Americas.
If you were to step into these Merchants’ houses, spy on their meetings, or buy them a drink at the local tavern, you wouldn’t hear Italian, or Spanish, or French. You’d hear something known locally as “Frankish” – a mix of Italian, Old French, Greek, Arabic and Portuguese. You couldn’t get anywhere in this world of trade, commerce and exploration without knowing this lingua franca (literally “Frankish language”), and once you’d mastered it, the world was quite literally your oyster.
Fast forward 500 years, to 2013, and there’s a new lingua franca in the worlds of trade, science and commerce: SQL.
Structured Query Language is a custom-built language for working with structured data. With a handful of verbs, and relatively simple grammar, you can perform almost any slice, manipulation or extraction of data you can imagine. Your bank uses it. Your blog uses it. Your phone uses it. (PRISM probably uses it.) And ScraperWiki uses it too.
All the data you collect in the new ScraperWiki—whether it’s from a PDF you’ve scraped, or a twitter stream you’ve searched, or a spreadsheet you’ve uploaded—all the data is structured with SQL. It’s this common underpinning that means all the tools on ScraperWiki are guaranteed to work with each other.
There’s one tool on ScraperWiki that lets you get your hands on this SQL directly, and see the results of your queries, in real-time, on any dataset in ScraperWiki. It’s called the Query with SQL tool, and here it is running on a dataset of my iTunes library:

Down the left-hand side, you’ll see a list of all your dataset’s tables and columns. You can hover over a column name to see some example values.
In the middle is where you’ll type your SQL queries. And then, on the right, is a table showing you the result. The tool’s read-only, so you don’t need to worry about destroying your data. Just have fun and explore.
The Query with SQL tool starts with a basic SQL query to get you going. But we can do so much better than that. The first thing any data scientist is going to do when faced with a brand new dataset, is get a quick idea of its structure. Looking at example values for all the columns is usually a good start.
select * from "tracks" limit 10
When you’re reading data from a SQL database, you start your query with select. Then you list the columns you want to get (or use the special * to select them all) and say the table they’re from. The double quotes around table and column names are optional, but advised, especially when working with columns that contain punctuation and spaces.
The above command produces a table that looks a lot like the default View in a table tool. That’s because View in a table is running this exact query when it’s showing you your data. So now you know 🙂
You can go a step further by getting some basic summary statistics for the more interesting columns:

See it in action
select
count("play_count") as "total tracks",
min("play_count") as "min plays",
avg("play_count") as "avg plays",
max("play_count") as "max plays",
sum("play_count") as "total plays"
from "tracks"
It turns out I’ve got 4699 tracks in my library, which I’ve played a total of 89670 times. The average number of plays per track is 19, and the most listened-to track has been played 282 times.
The count() function is particularly powerful when combined with group by, to show frequency distributions across your data in a flash:
select
"genre",
count("genre") as "total tracks"
from "tracks"
group by "genre"
You can even order the output, using order by, to see the most common genres at the top:
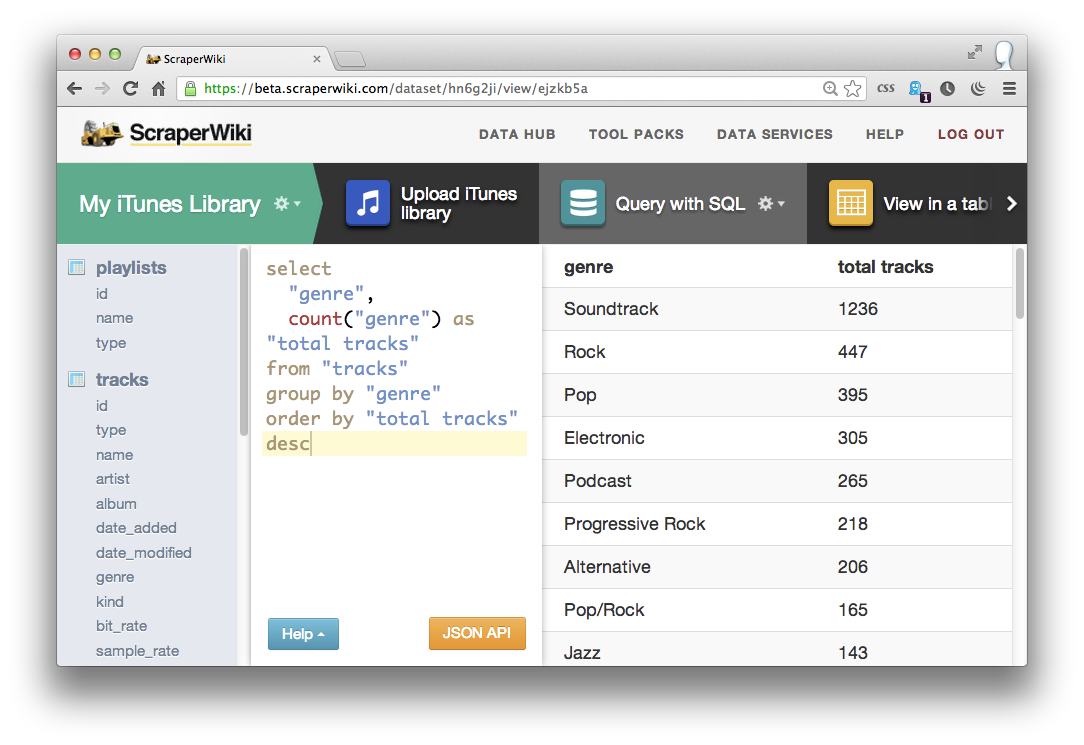
select
"genre",
count("genre") as "total tracks"
from "tracks"
group by "genre"
order by "total tracks" desc
Running that query on my iTunes data reveals my addiction to Soundtracks (1236 tracks), Electronic music (305 tracks) and Prog Rock (218 tracks) amongst others. Changing the count("genre") function to a sum("total_plays") shows me the total plays for each genre, rather than the total tracks:

select
"genre",
sum("play_count") as "total plays"
from "tracks"
group by "genre"
order by "total plays" desc
By now, you’ll probably want to investigate only rows in your database where a particular thing is true, or a certain condition is met. In this case, lets investigate that “Electronic” category. Which are the most popular artists?
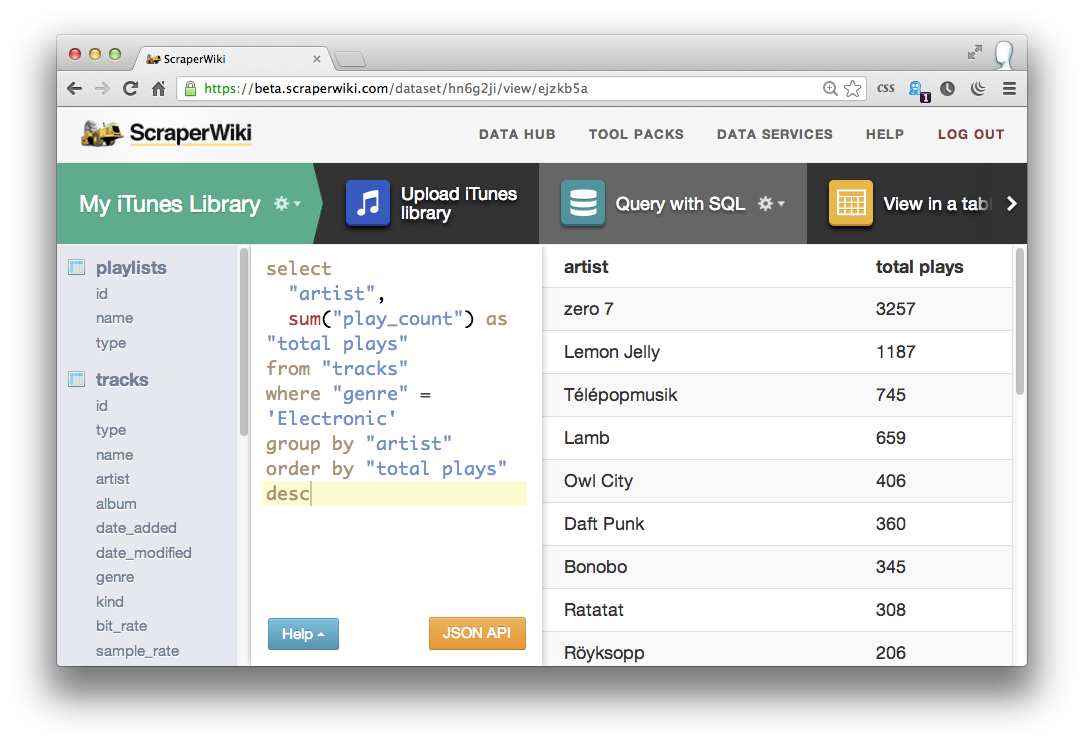
select
"artist",
sum("play_count") as "total plays"
from "tracks"
where "genre" = 'Electronic'
group by "artist"
order by "total plays" desc
Zero 7 (3257 plays – nearly 40% of all plays in that genre, and 4% of all the music I’ve ever listened to – scary), Lemon Jelly (1187 plays) and Télépopmusik (745 plays). Cool. How about my favourite artists over the last two months?
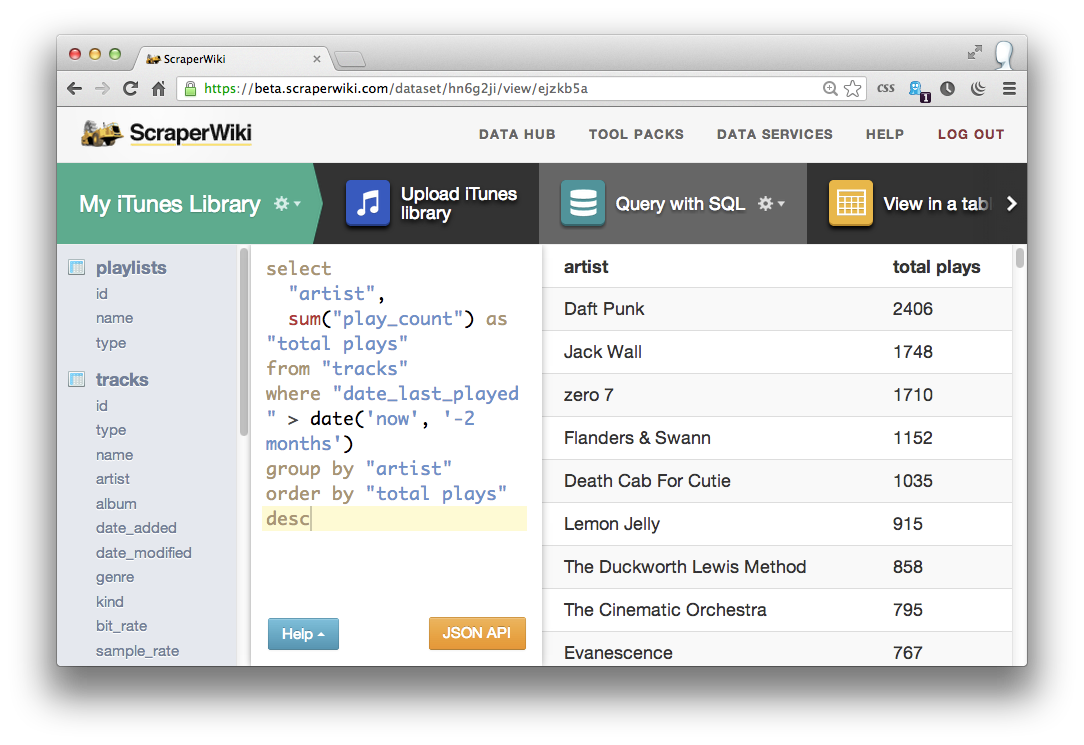
select
"artist",
sum("play_count") as "total plays"
from "tracks"
where "date_last_played" > date('now', '-2 months')
group by "artist"
order by "total plays" desc
SQLite has a really awesome date() function which takes two arguments: a date/time or the word “now” as a first argument, and a time difference as a second, meaning you can easily work with date ranges and totals over time.
My recent Daft punk obsession is quickly laid bare by SQL’s awesome date comparison power. 2406 plays in the last 2 months – that’s an average of 40 a day. Sheesh, I think I actually have a problem.
 Finally, let’s say I wanted to publicise my French Electro-pop addiction – perhaps to a Daft Punkers Anonymous support forum. Just like Classic before it, the new ScraperWiki exposes all of its data via a SQL web endpoint, which returns JSON just begging to be fed into your own custom apps and online visualisations. Complete destruction of my musical reputation is only a short, sharp press of the orange “JSON API” button away.
Why not give the Query with SQL tool a go on your datasets, and let me know what other hidden gems you discover?
Trackbacks/Pingbacks
[…] the tweets with at least one retweet. This set of data can be generated from the tweets using the Query with SQL tool. SQL is a database querying language of long pedigree. I then exported the tweets to Word and […]